Chapter 15
Financial Statement Analysis
Review Questions
1. What are the three main ways to analyze financial statements?
2. What is an annual report? Briefly describe the key parts of the annual report.
3. What is horizontal analysis, and how is a percentage change computed?
4. What is trend analysis, and how does it differ from horizontal analysis?
5. What is vertical analysis? What item is used as the base for the income statement? What item is used
as the base for the balance sheet?
6. Describe a common-size statement and how it might be helpful in evaluating a company.
7. What is benchmarking, and what are the two main types of benchmarks in financial statement
8. Briefly describe the ratios that can be used to evaluate a company’s ability to pay current liabilities.
The financial measures that are used to evaluate the ability of a company to pay its current liabilities
are:
9. Briefly describe the ratios that can be used to evaluate a company’s ability to sell merchandise
inventory and collect receivables.
The ratios that are used to evaluate a company’s ability to sell merchandise inventory and collect
receivables are:
• Inventory turnover—measures the number of times a company sells its average level of
merchandise inventory during a period. Cost of goods sold/ Average merchandise inventory.
10. Briefly describe the ratios that can be used to evaluate a company’s ability to pay long-term debt.
The ratios that can be used to evaluate a company’s ability to pay long-term debt are:
11. Briefly describe the ratios that can be used to evaluate a company’s profitability.
The ratios that can be used to evaluate a company’s profitability are:
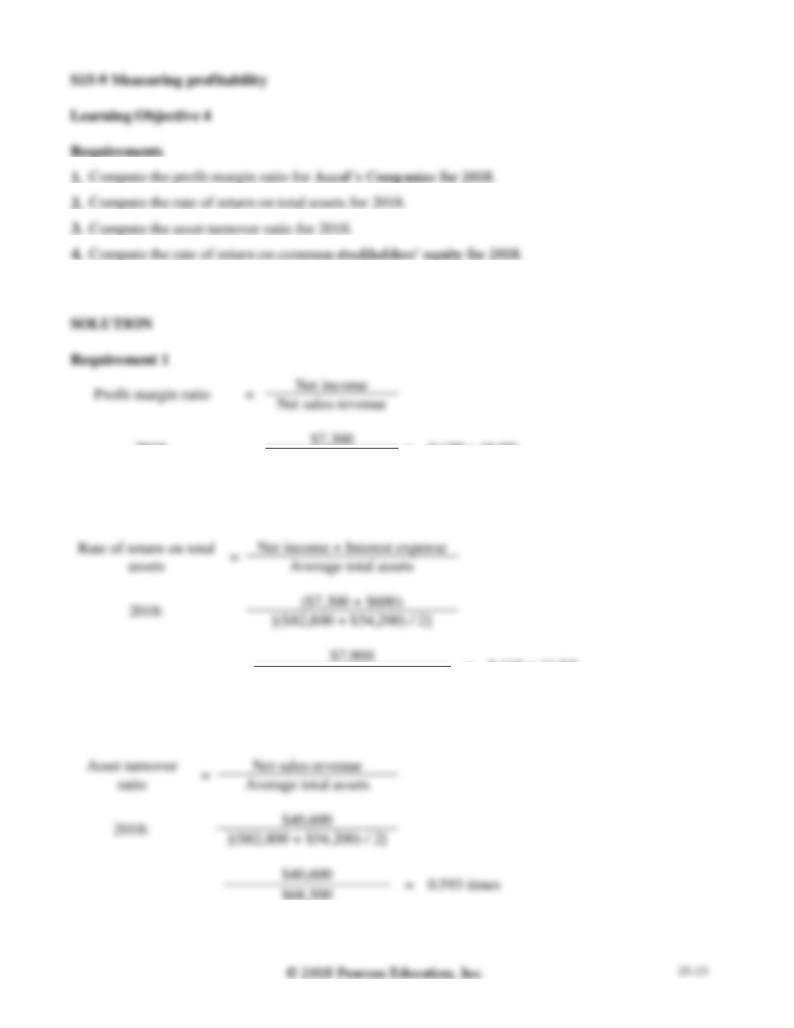
• Profit margin ratio—Shows how much net income is earned on every dollar of sales: Net income
/ Net sales revenue.
• Rate of return on total assets—Measures the success a company has in using its assets to earn
income: (Net income + Interest expense) / Average total assets.
12. Briefly describe the ratios that can be used to evaluate a company’s stock as an investment.
The ratios that can be used to evaluate a company’s stock as an investment are:
• Price / earnings ratio—The market price of a share of common stock in relation to the company’s
•
Short Exercises
S15-1 Explaining financial statements
Learning Objective 1
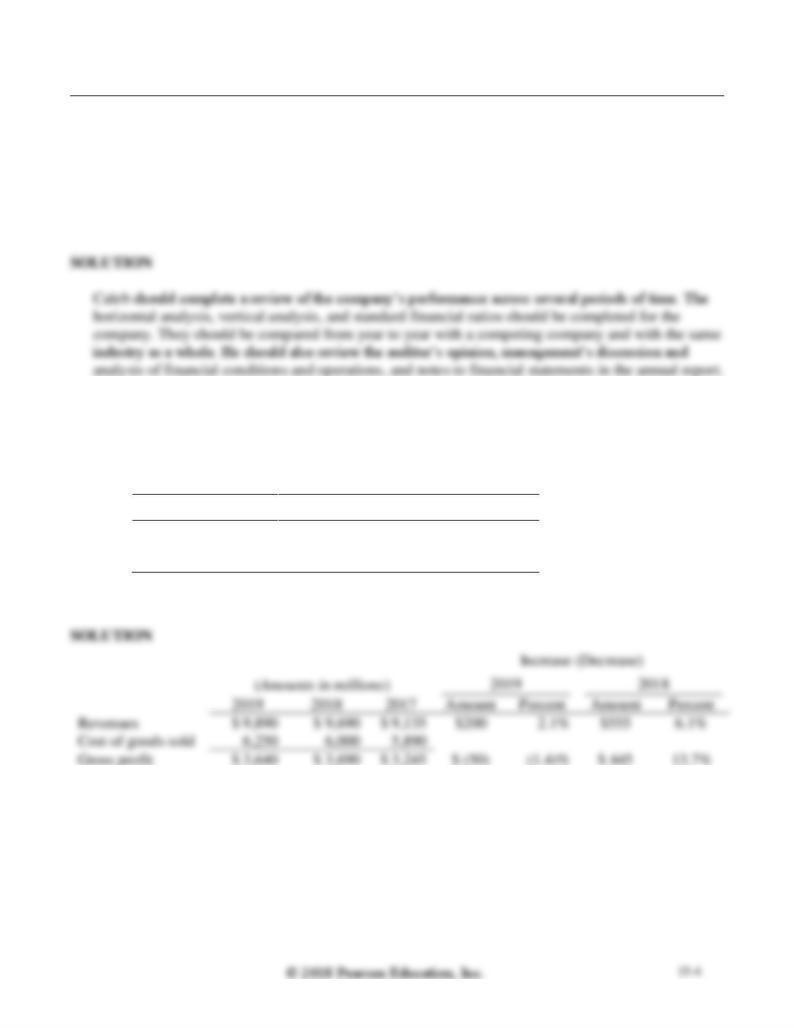
Caleb King is interested in investing in Orange Corporation. What types of tools should Caleb use to
evaluate the company?
S15-2 Performing horizontal analysis
Learning Objective 2
Verifine Corp. reported the following on its comparative income statement:
(In millions)
2019
2018
2017
Revenue
$ 9,890
$ 9,690
$ 9,135
Cost of Goods Sold
6,250
6,000
5,890
Prepare a horizontal analysis of revenues and gross profit—both in dollar amounts and in percentages—
for 2019 and 2018.
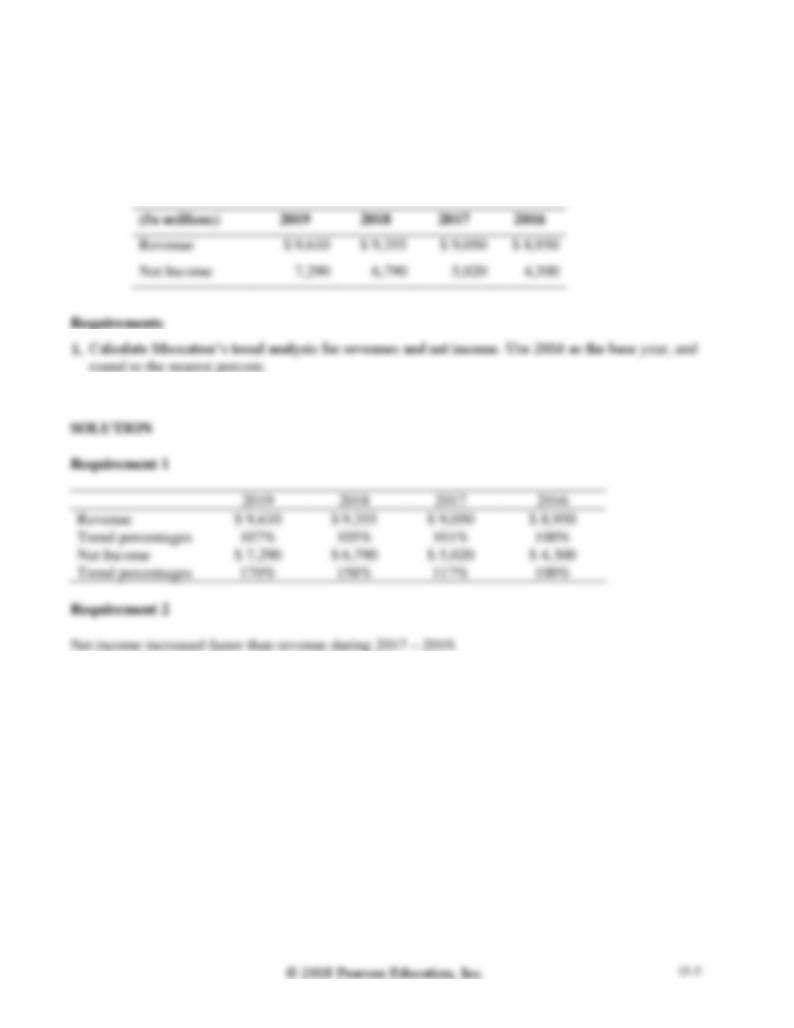
S15-3 Calculating trend analysis
Learning Objective 2
Muscateer Corp. reported the following revenues and net income amounts:
2. Which measure increased at a higher rate during 2017–2019?
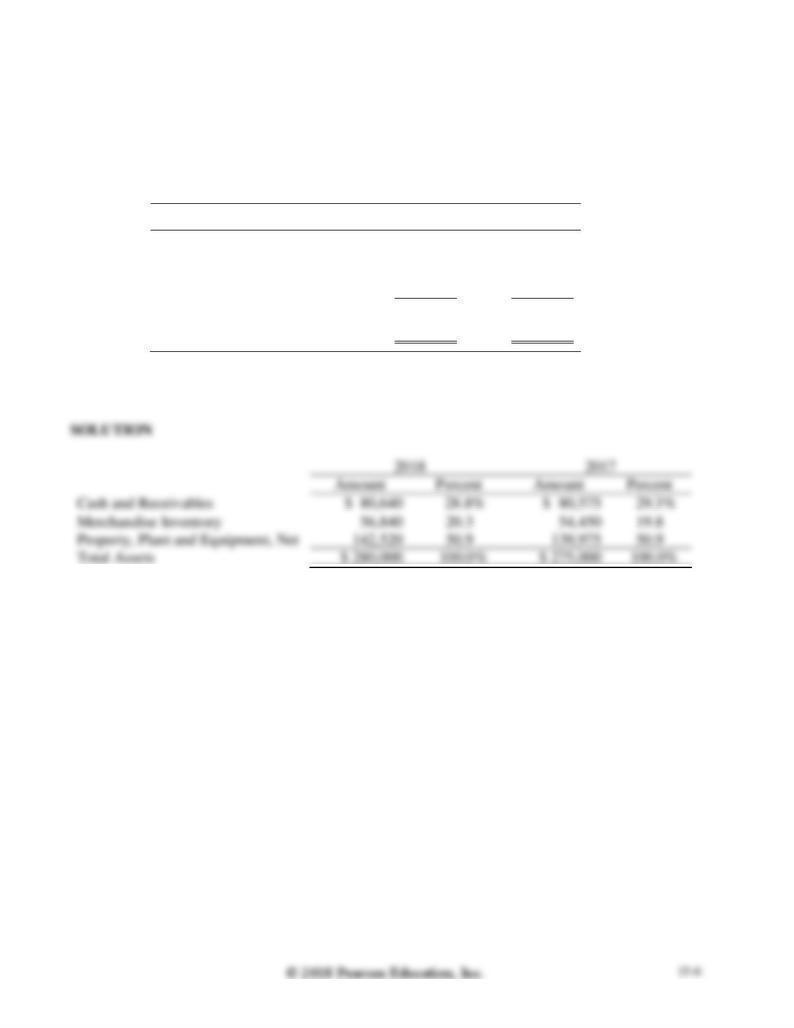
S15-4 Performing vertical analysis
Learning Objective 3
Great Value Optical Company reported the following amounts on its balance sheet at December 31,
2018 and 2017:
2018
2017
Cash and Receivables
$ 80,640
$ 80,575
Merchandise Inventory
56,840
54,450
Property, Plant, and
Equipment, Net
142,520
139,975
Total Assets
$ 280,000
$ 275,000
Prepare a vertical analysis of Great Value’s assets for 2018 and 2017.
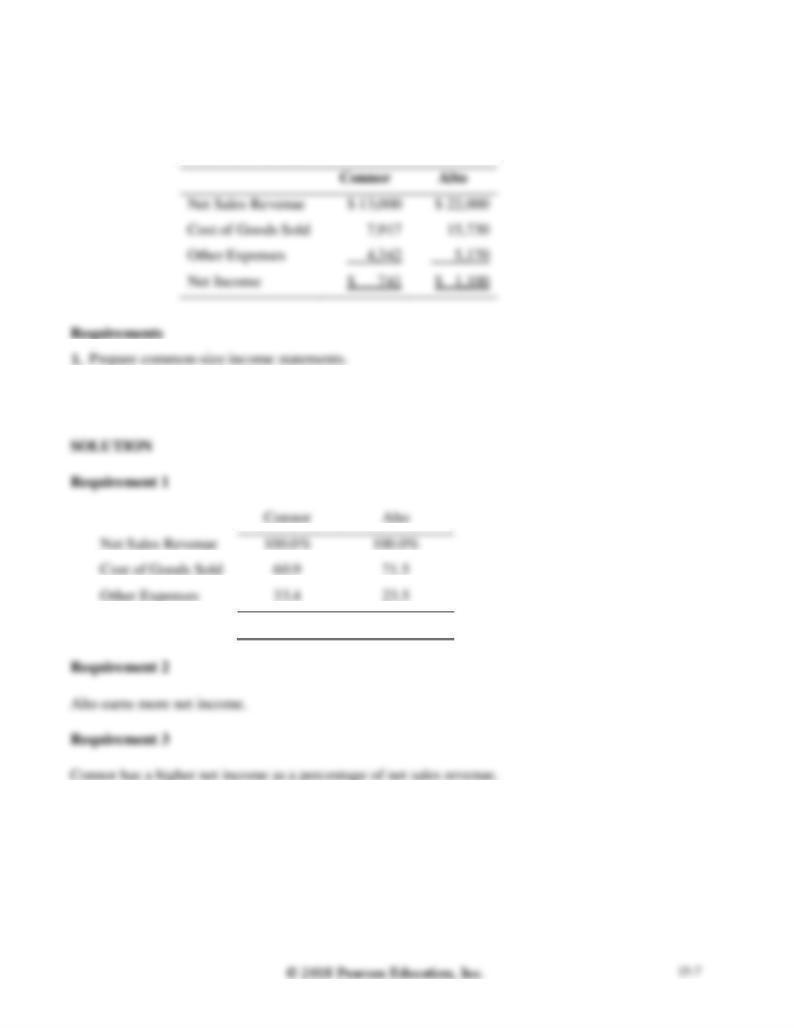
S15-5 Preparing common-size income statement
Learning Objective 3
Data for Connor, Inc. and Alto Corp. follow:
2. Which company earns more net income?
3. Which company’s net income is a higher percentage of its net sales revenue?
Net Income
5.7%
5.0%
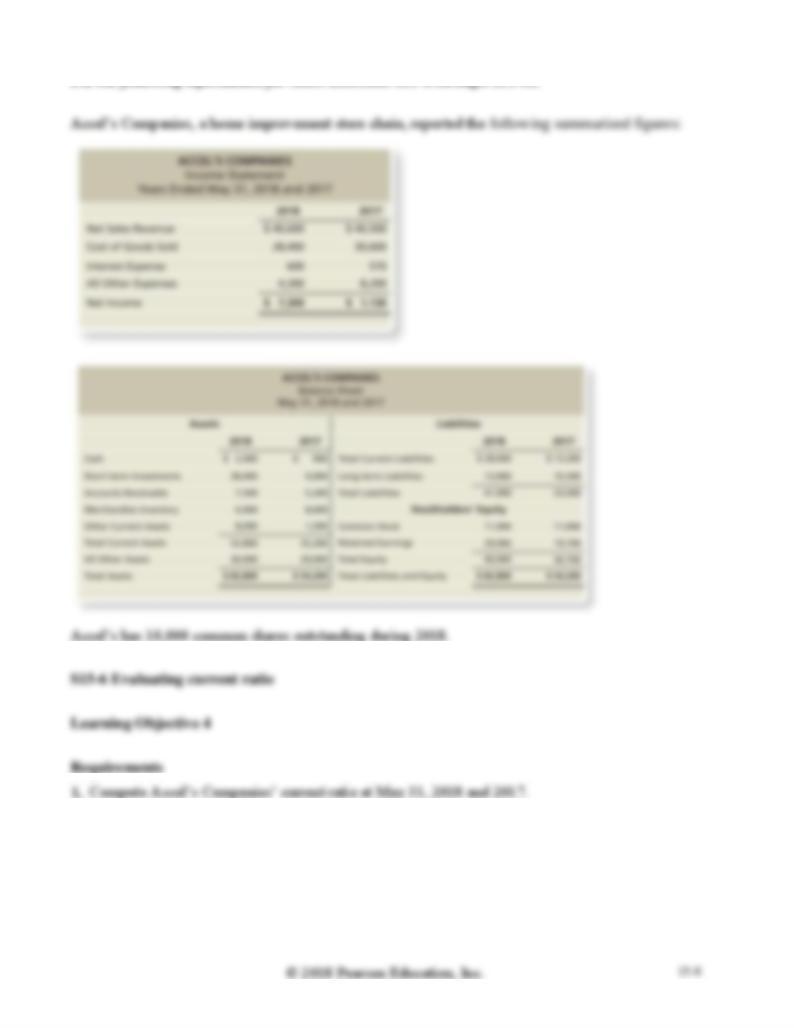
Use the following information for Short Exercises S15-6 through S15-10.
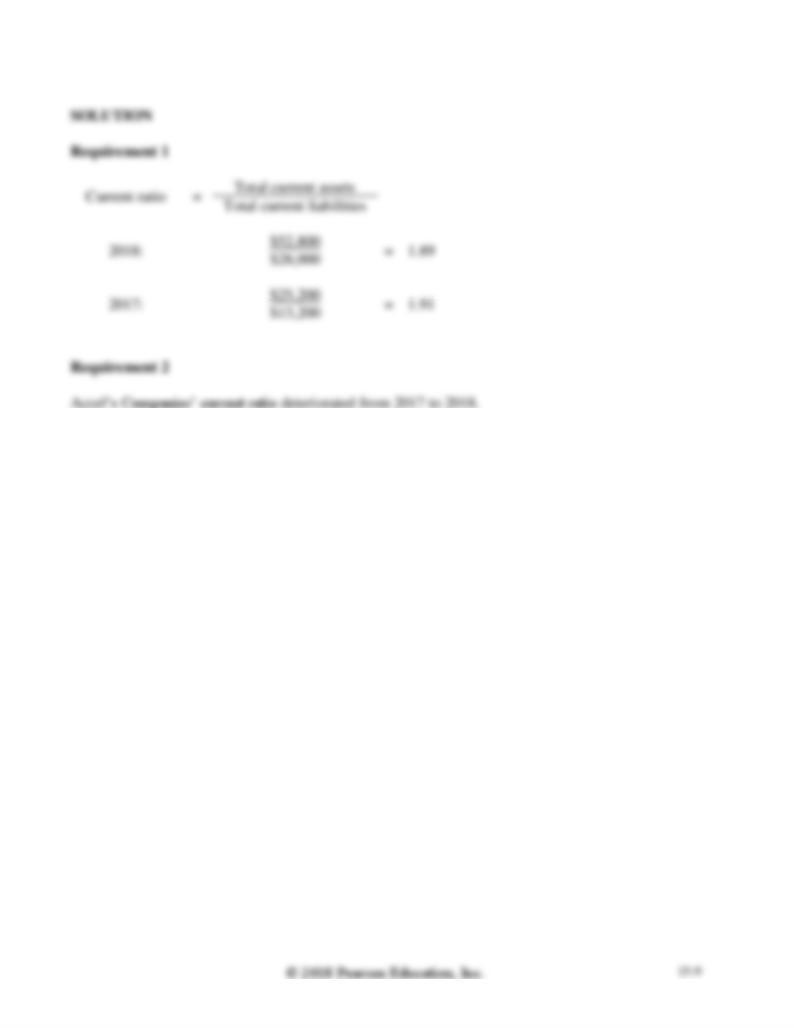
2. Did Accel’s Companies’ current ratio improve, deteriorate, or hold steady during 2018?
S15-6, cont.
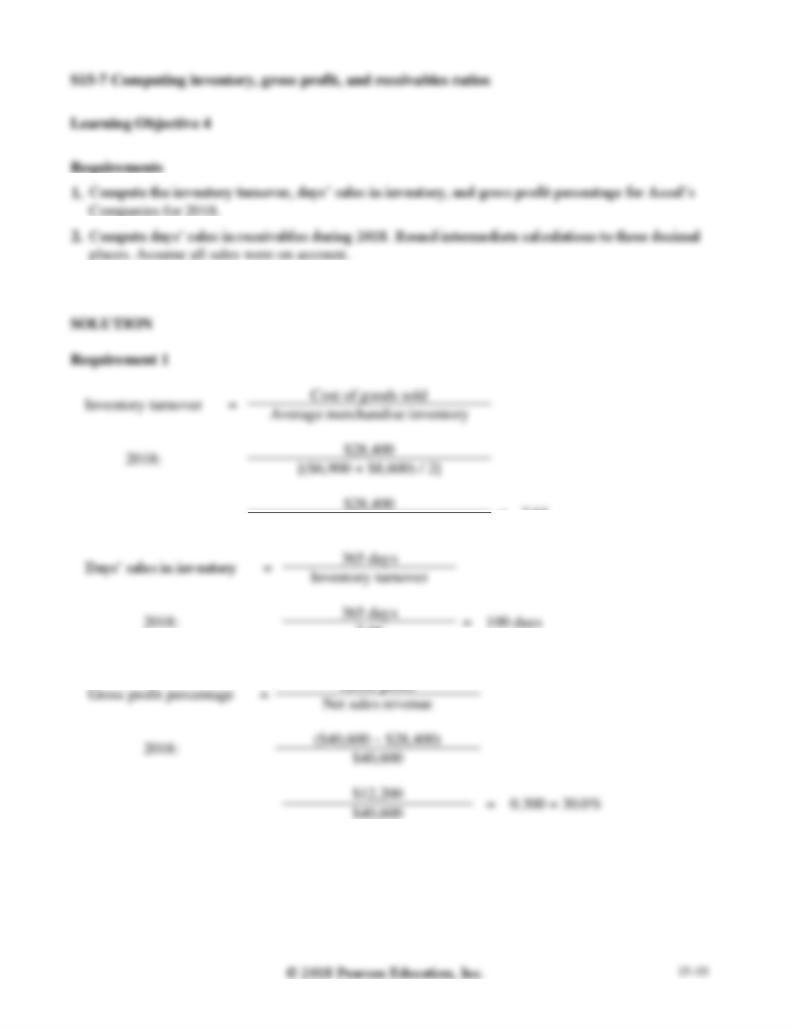
3. What do these ratios say about Accel’s Companies’ ability to sell inventory and collect receivables?
=
3.66
$7,750
3.66
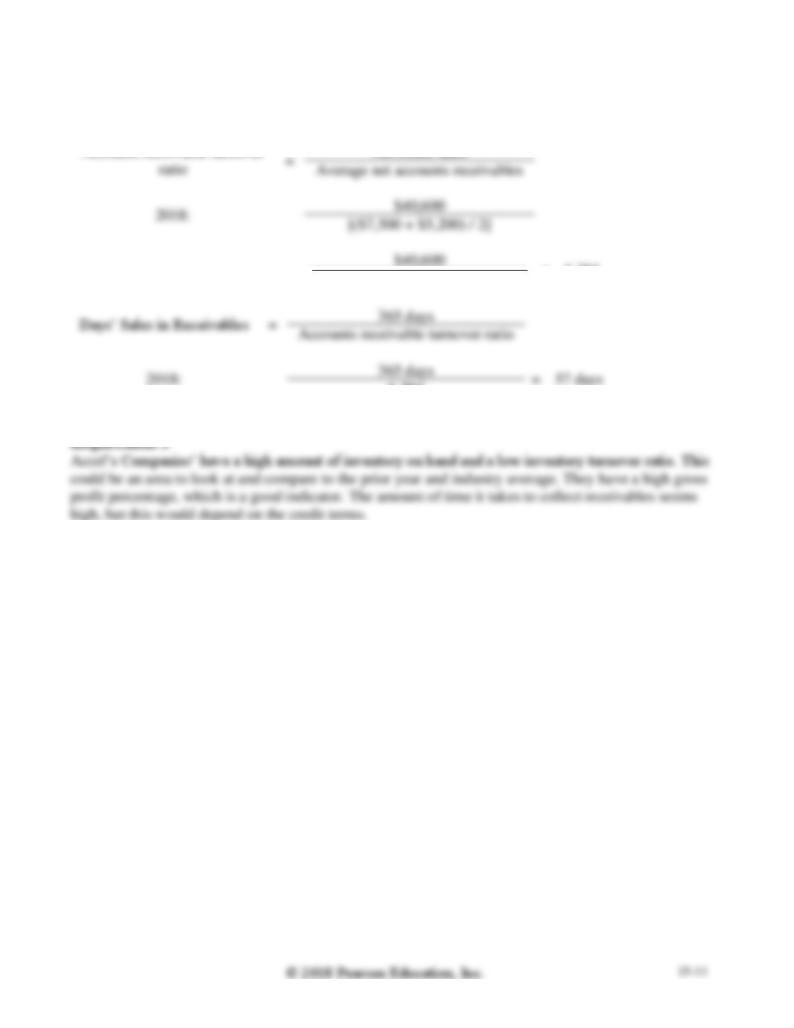
S15-7, cont.
Requirement 2
$6,350
=
6.394
6.394
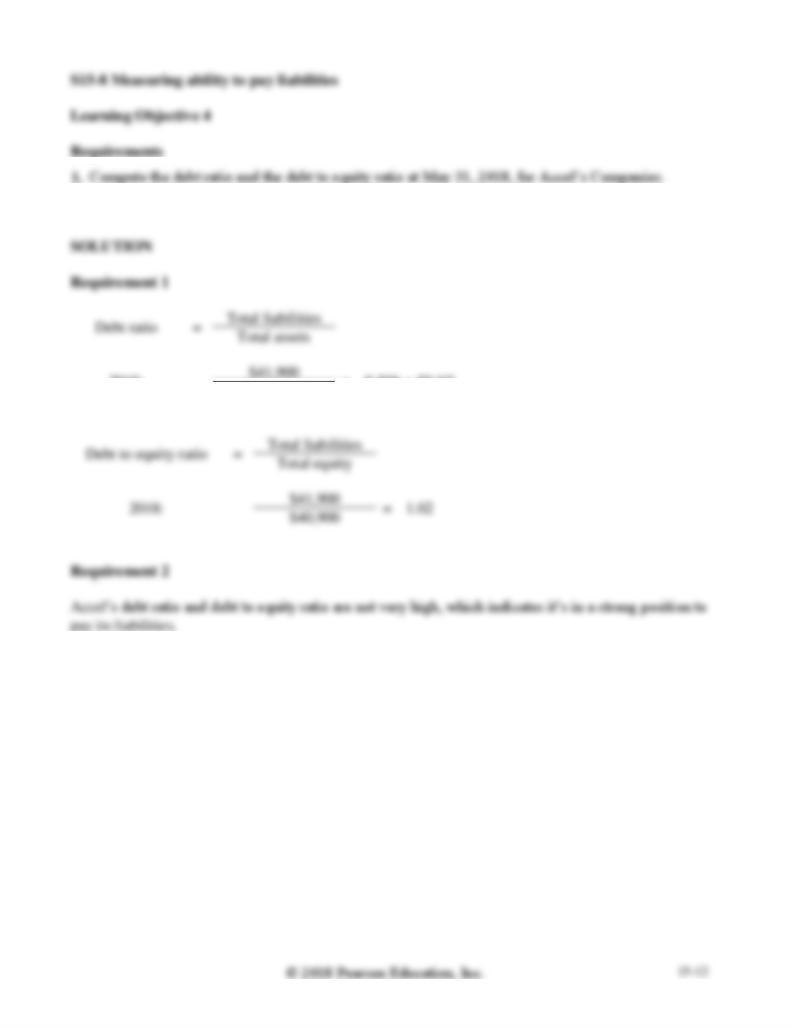
2. Is Accel’s ability to pay its liabilities strong or weak? Explain your reasoning.
2018:
=
0.506 = 50.6%
$82,800
5. Are these rates of return strong or weak? Explain your reasoning.
2018:
=
0.180 = 18.0%
$40,600
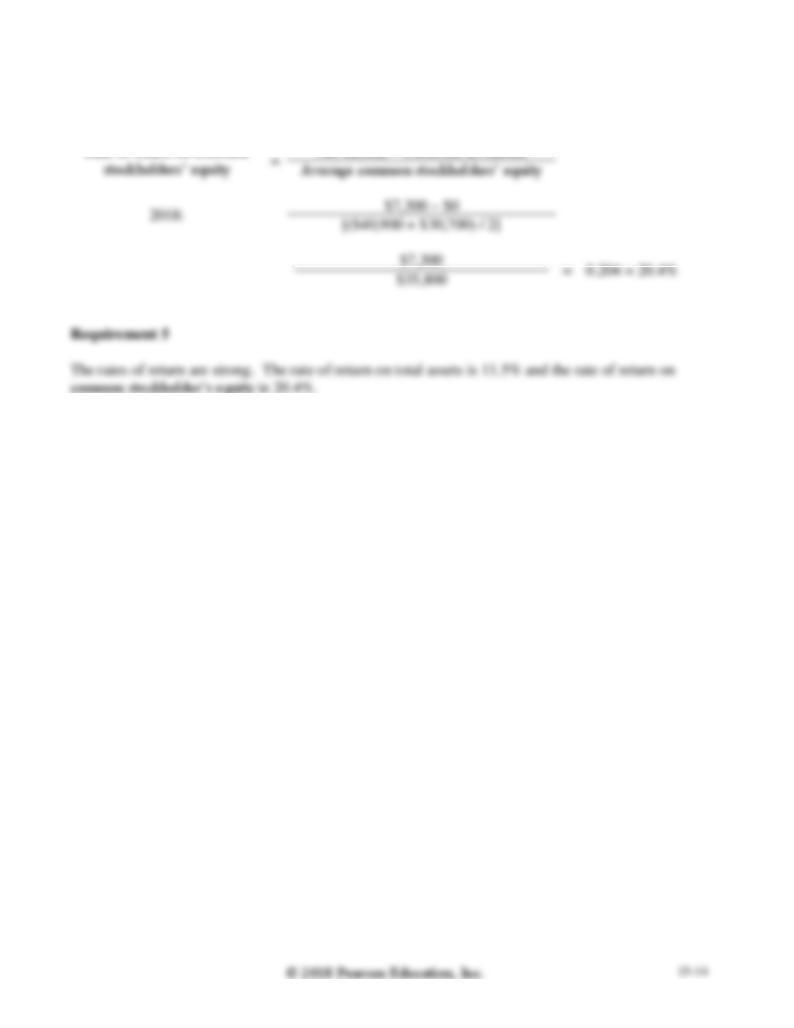
Requirement 2
68,500
=
0.115 = 11.5%
Requirement 3
S15-9, cont.
Requirement 4
3. What do these results mean when evaluating Accel’s Companies’ profitability?
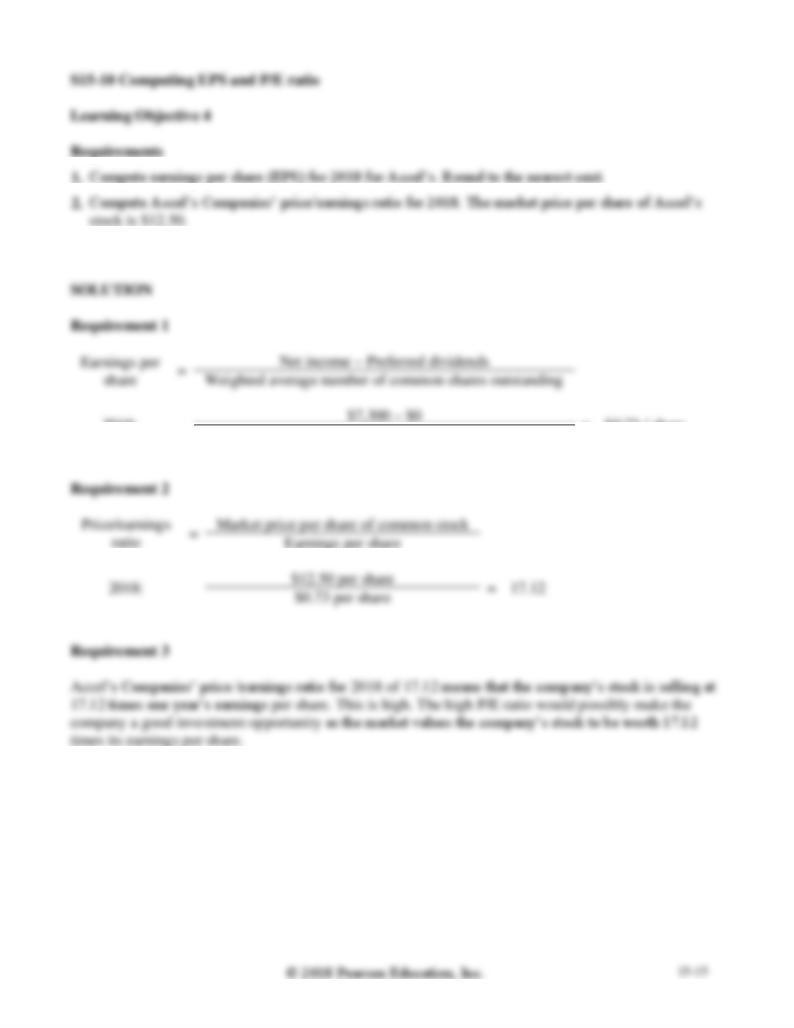
2018:
=
$0.73 / share
10,000 shares
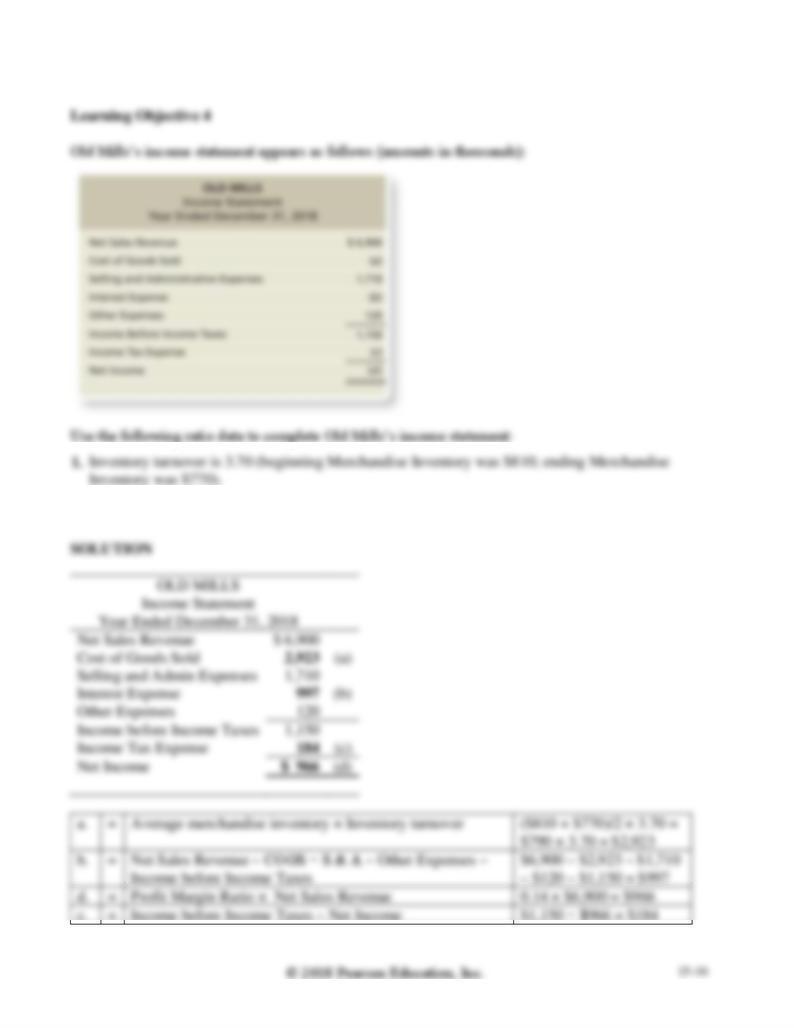
S15-11 Using ratios to reconstruct an income statement
2. Profit margin ratio is 14%.
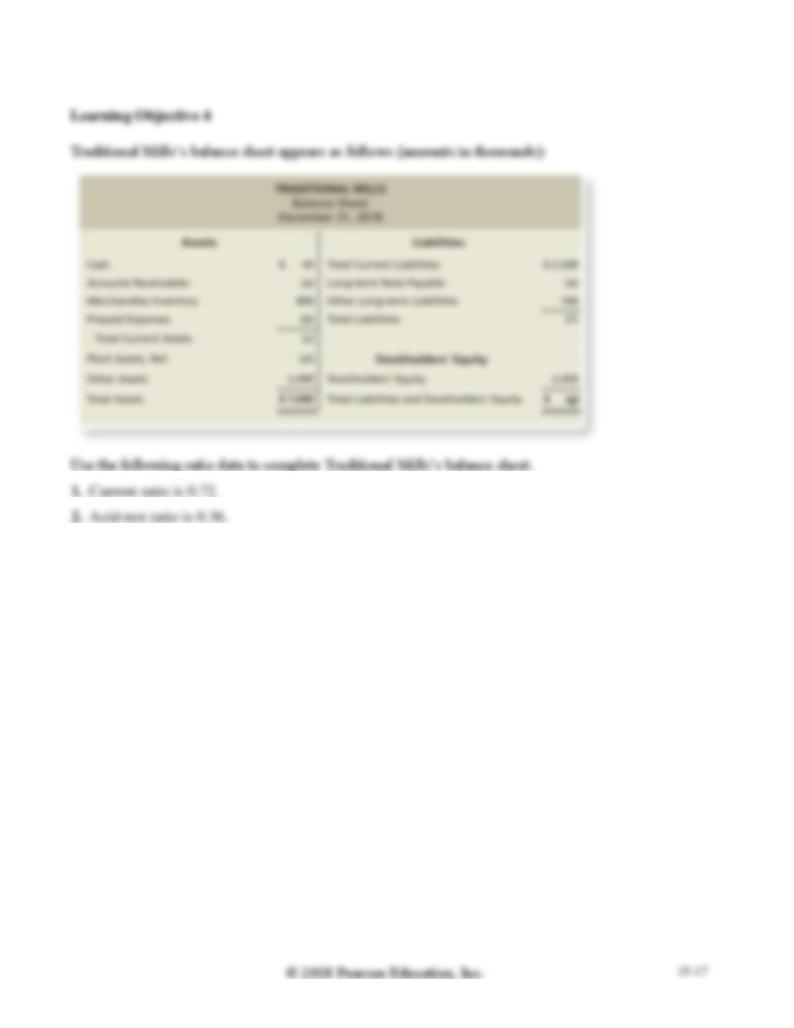
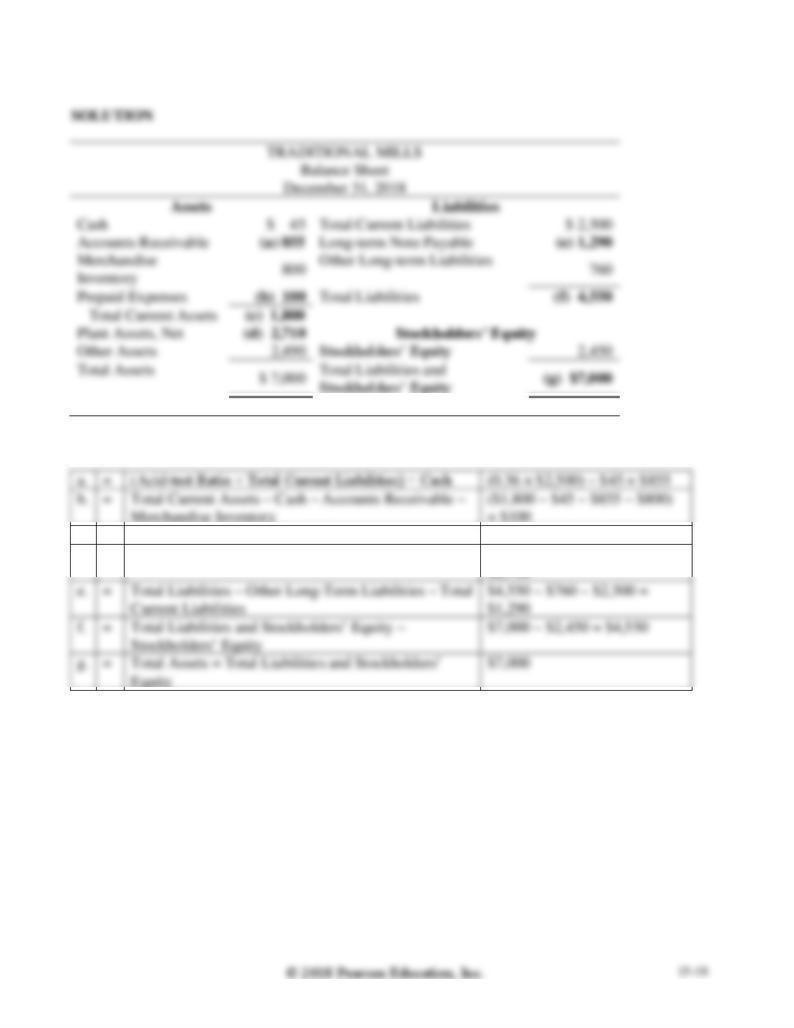
S15-12 Using ratios to reconstruct a balance sheet
S15-12, cont.
c.
=
Current Ratio × Current Liabilities
0.72 × $2,500 = $1,800
d.
=
Total Assets – Total Current Assets – Other Assets
$7,000 – $1,800 – $2,490 =
Exercises
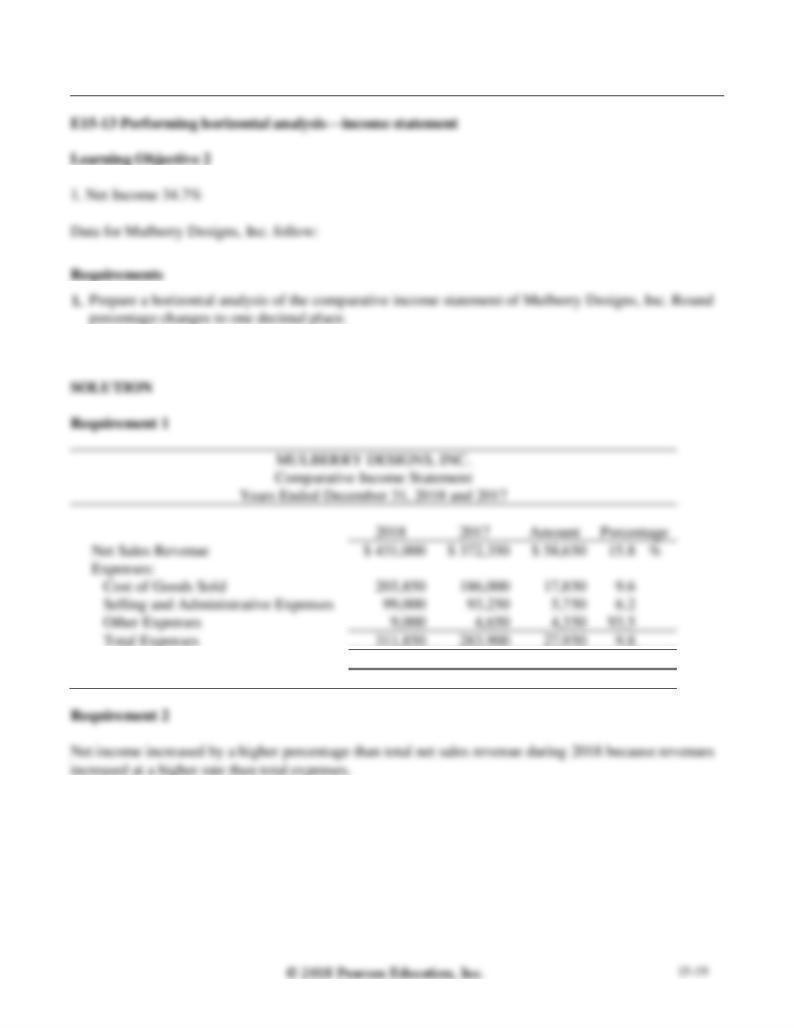
2. Why did 2018 net income increase by a higher percentage than net sales revenue?
Net Income
$ 119,150
$ 88,450
$ 30,700
34.7
%

1. 2019 Net Income 153%
2. Which grew faster during the period, net revenue or net income?

E15-15 Performing vertical analysis of a balance sheet
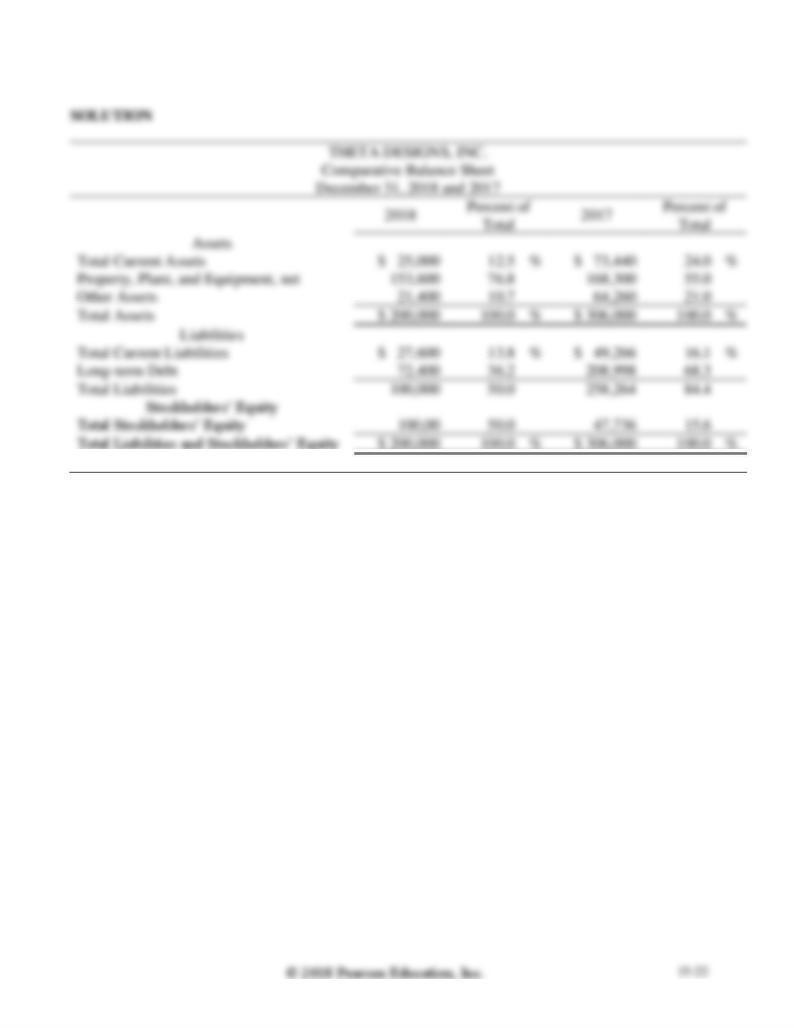
E15-15, cont.
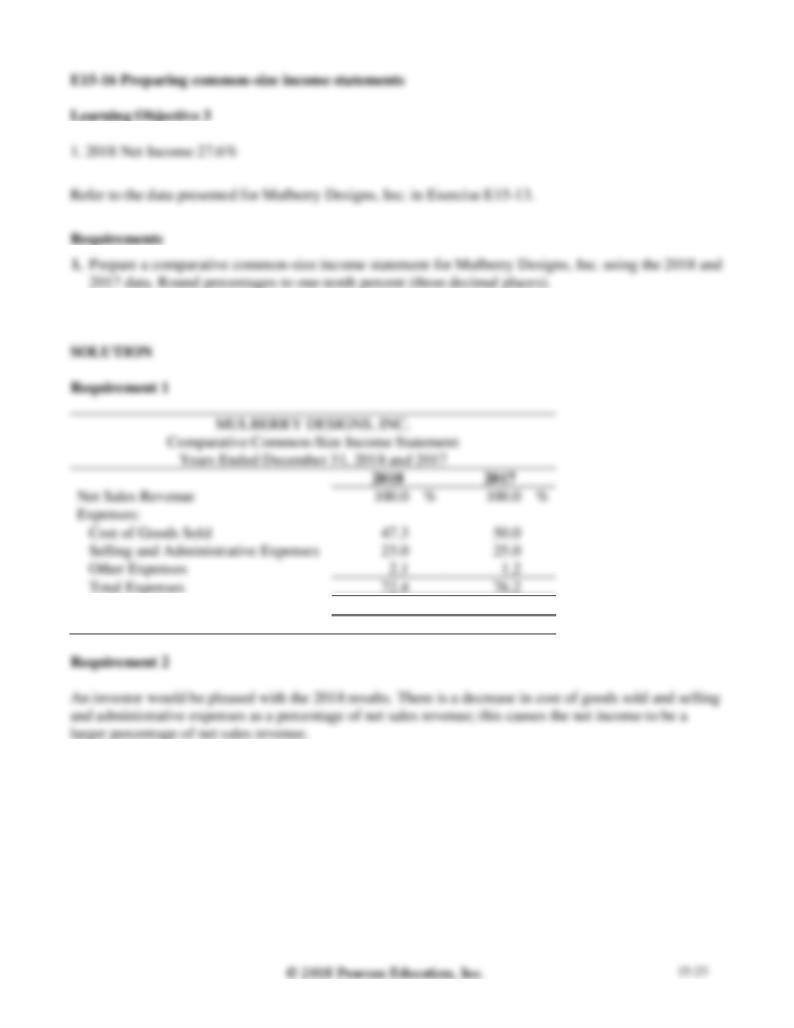
2. To an investor, how does 2018 compare with 2017? Explain your reasoning.
Net Income
27.6
%
23.8
%
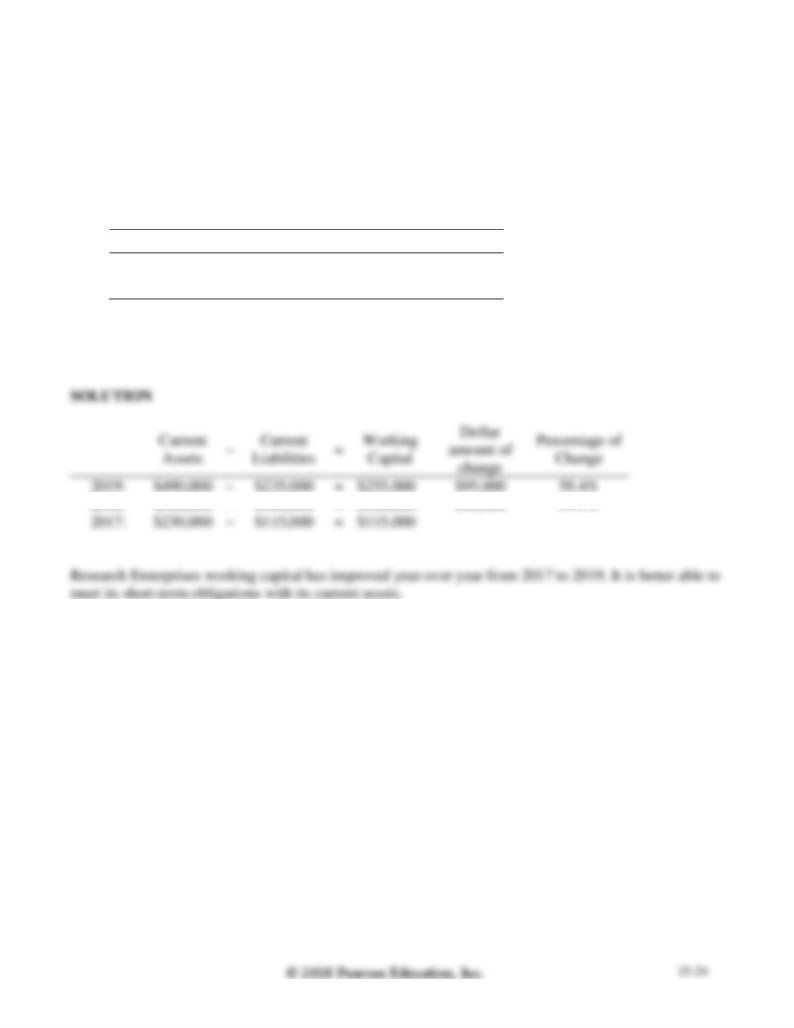
E15-17 Computing working capital changes
Learning Objective 4
2019 Working Capital $255,000
Data for Research Enterprises follows:
2019
2018
2017
Total Current Assets
$ 490,000
$ 320,000
$ 230,000
Total Current Liabilities
235,000
160,000
115,000
Compute the dollar amount of change and the percentage of change in Research Enterprises’s working
capital each year during 2019 and 2018. What do the calculated changes indicate?
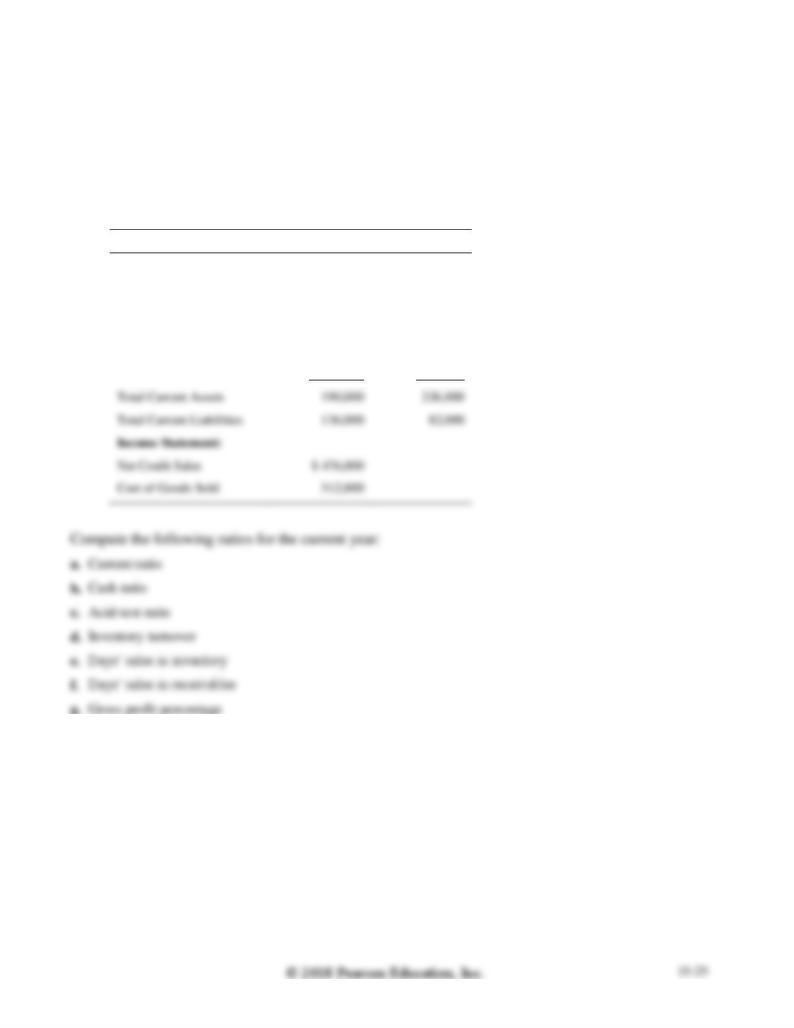
E15-18 Computing key ratios
Learning Objective 4
e. 89 days
The financial statements of Valerie’s Natural Foods include the following items:
Current Year
Preceding Year
Balance Sheet:
Cash
$ 16,000
$ 26,000
Short-term Investments
19,000
28,000
Net Accounts Receivable
60,000
92,000
Merchandise Inventory
78,000
74,000
Prepaid Expenses
17,000
6,000
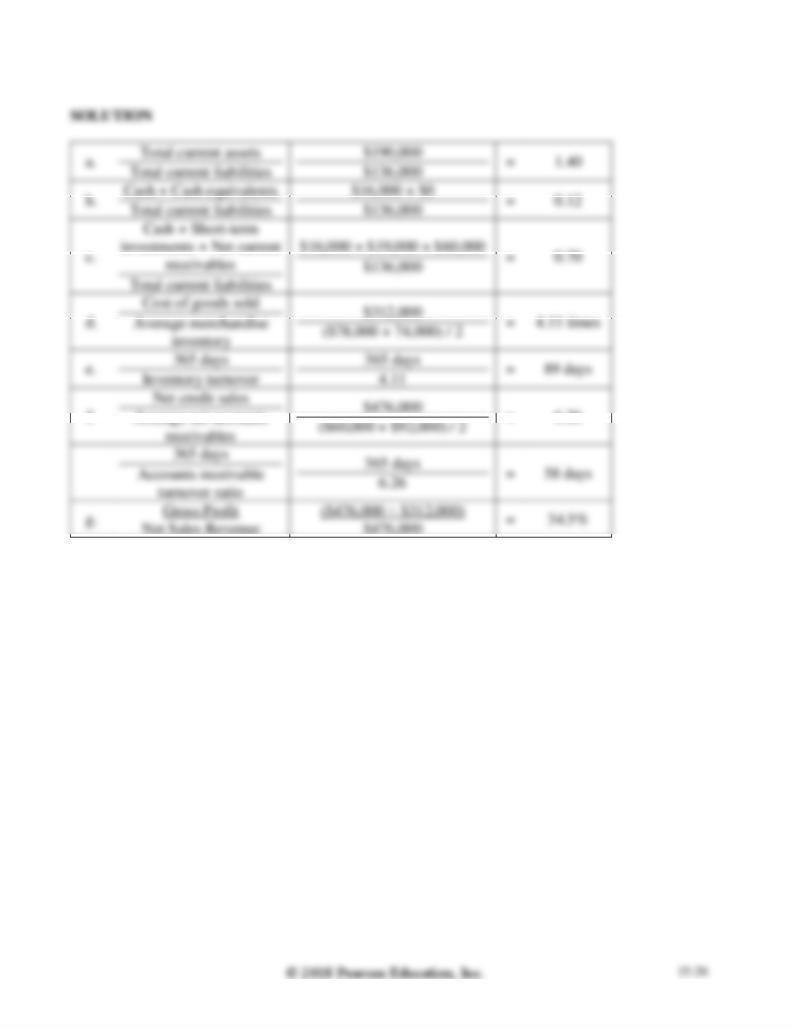
E15-18, cont.
f.
=
6.26
E15-19 Analyzing the ability to pay liabilities
Learning Objective 4
d. 2018: 61.9%
Big Beautiful Photo Shop has asked you to determine whether the company’s ability to pay current
liabilities and total liabilities improved or deteriorated during 2018. To answer this question, you gather
the following data:
2018
2017
Cash
$ 58,000
$ 47,000
Short-term Investments
34,000
0
Net Accounts Receivable
140,000
124,000
E15-19, cont.
b.
=
0.20
=
0.23
e.
=
1.62
=
0.82
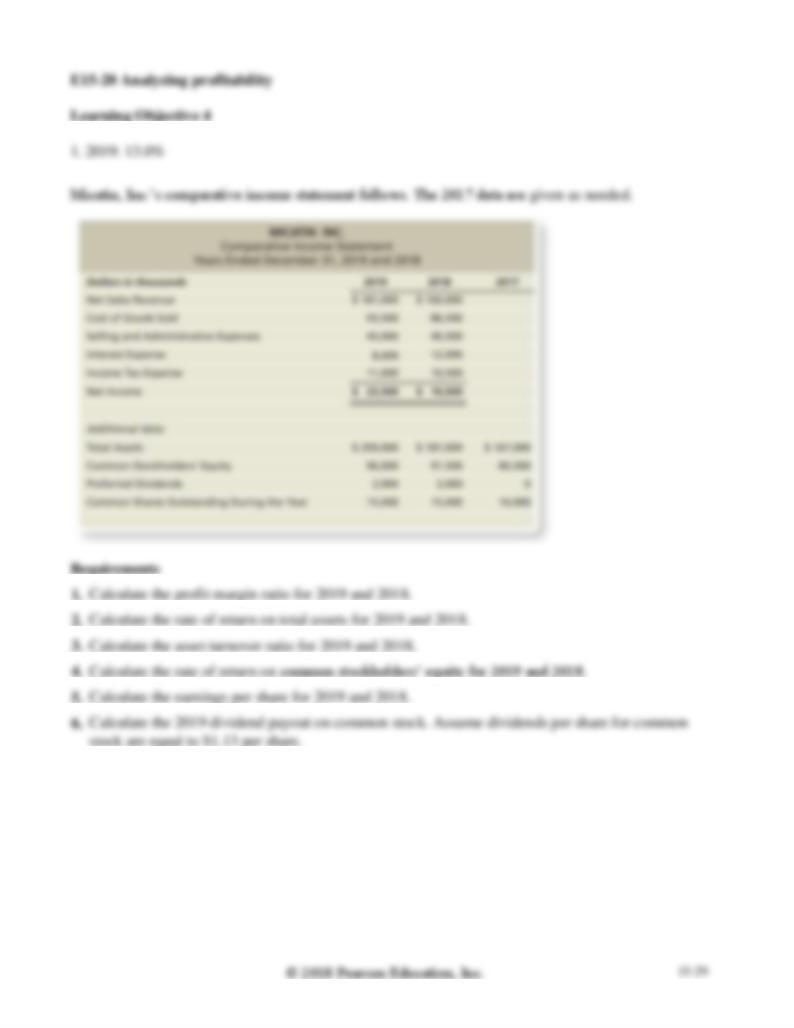
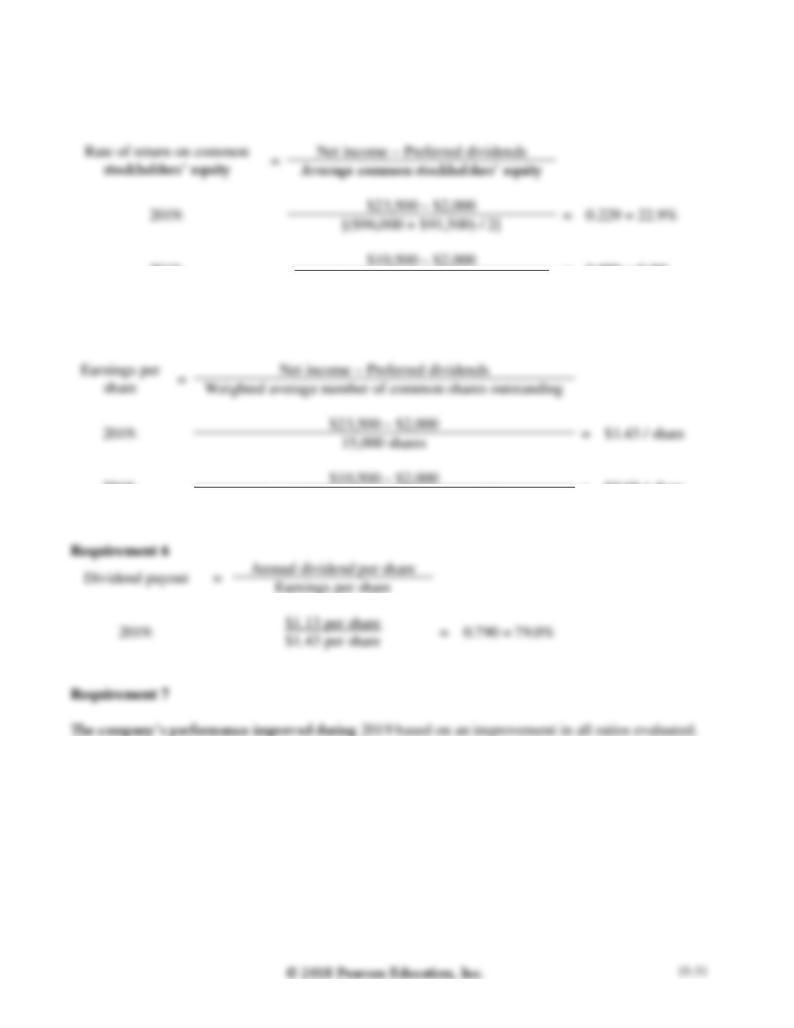
7. Did the company’s operating performance improve or deteriorate during 2019?
E15-20, cont.
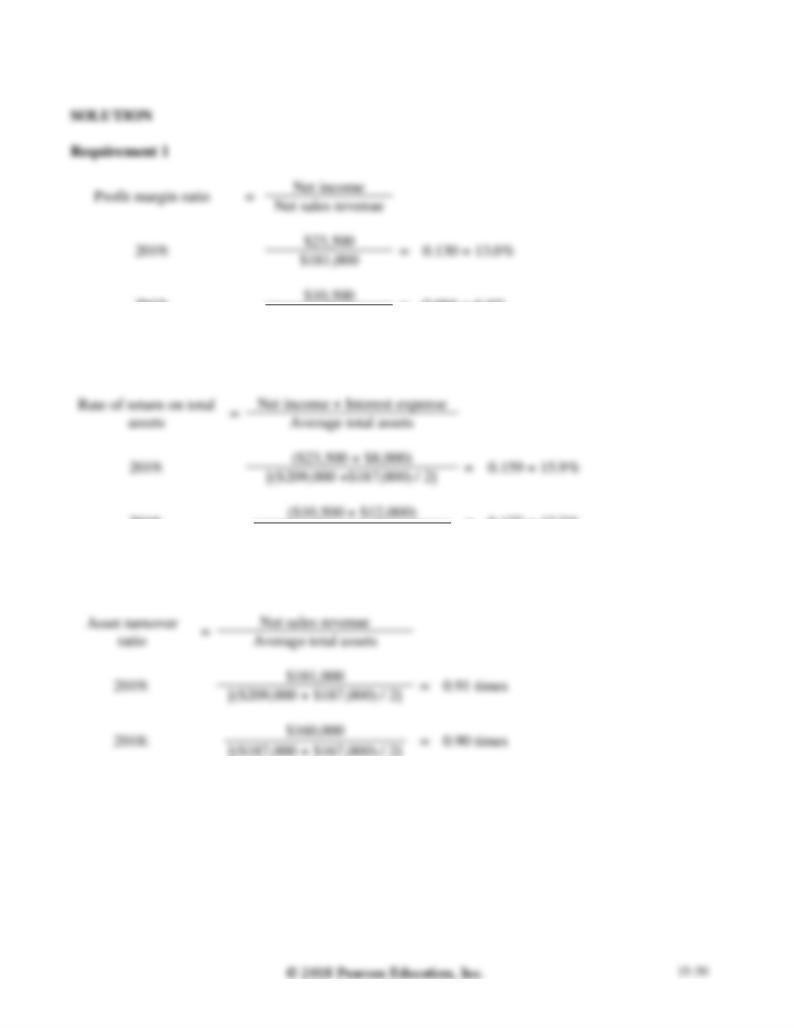
2018:
=
0.066 = 6.6%
$160,000
Requirement 2
2018:
[($187,000 + $167,000) / 2]
=
0.127 = 12.7%
Requirement 3
E15-20, cont.
Requirement 4
2018:
[($91,500 + $80,500) / 2]
=
0.090 = 9.9%
Requirement 5
2018:
=
$0.68 / share
[(15,000 shares + 10,000 shares) / 2]
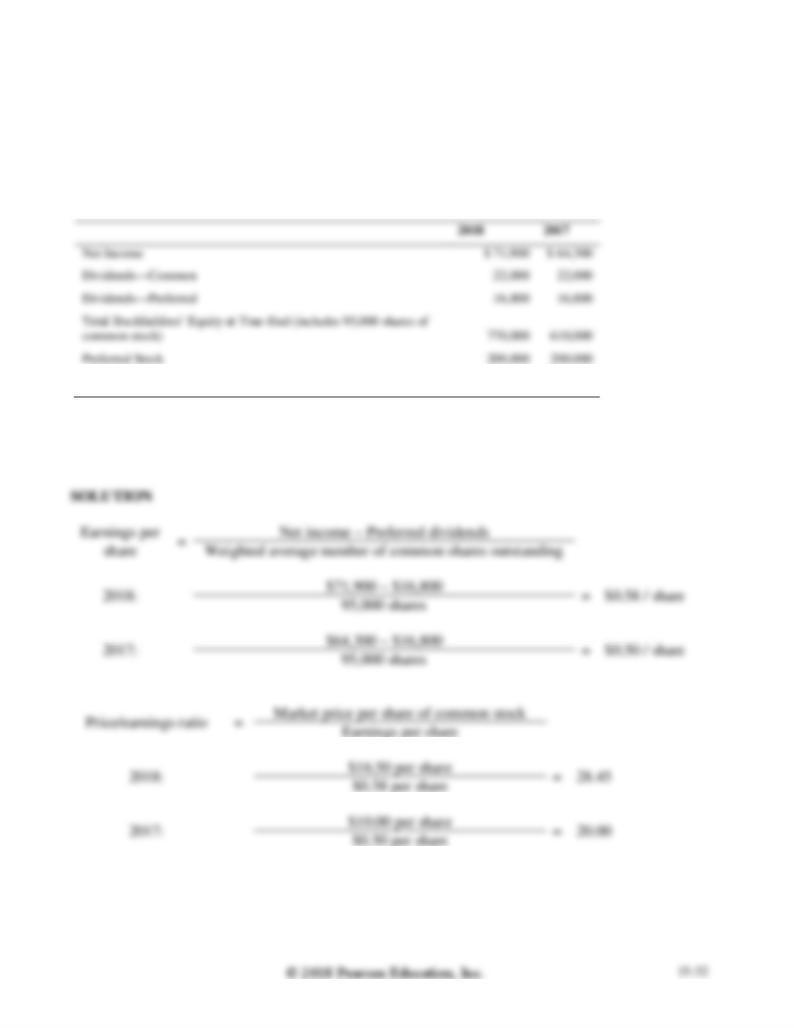
E15-21 Evaluating a stock as an investment
Learning Objective 4
Dividend Yield 2018: 1.4%
Data for Oxford State Bank follow:
Market Price per Share of Common Stock
$ 16.50
$ 10.00
Evaluate the common stock of Oxford State Bank as an investment. Specifically, use the three stock
ratios to determine whether the common stock has increased or decreased in attractiveness during the
past year. Round to two decimal places.
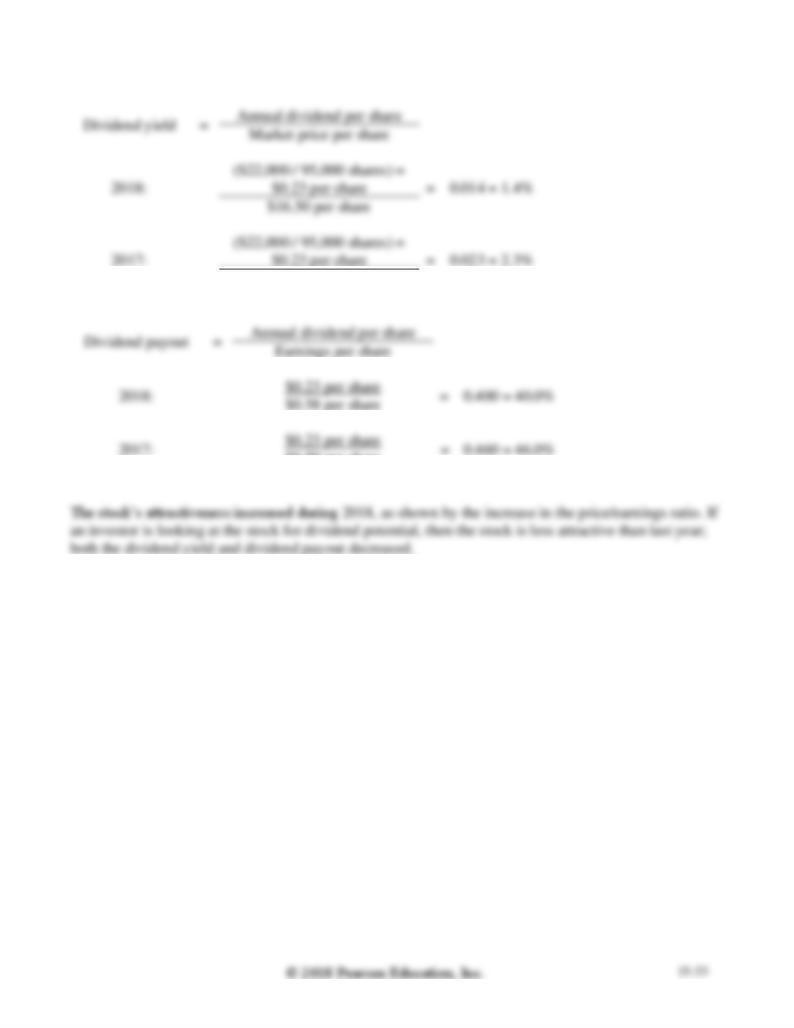
E15-21, cont.
$10.00 per share
$0.50 per share
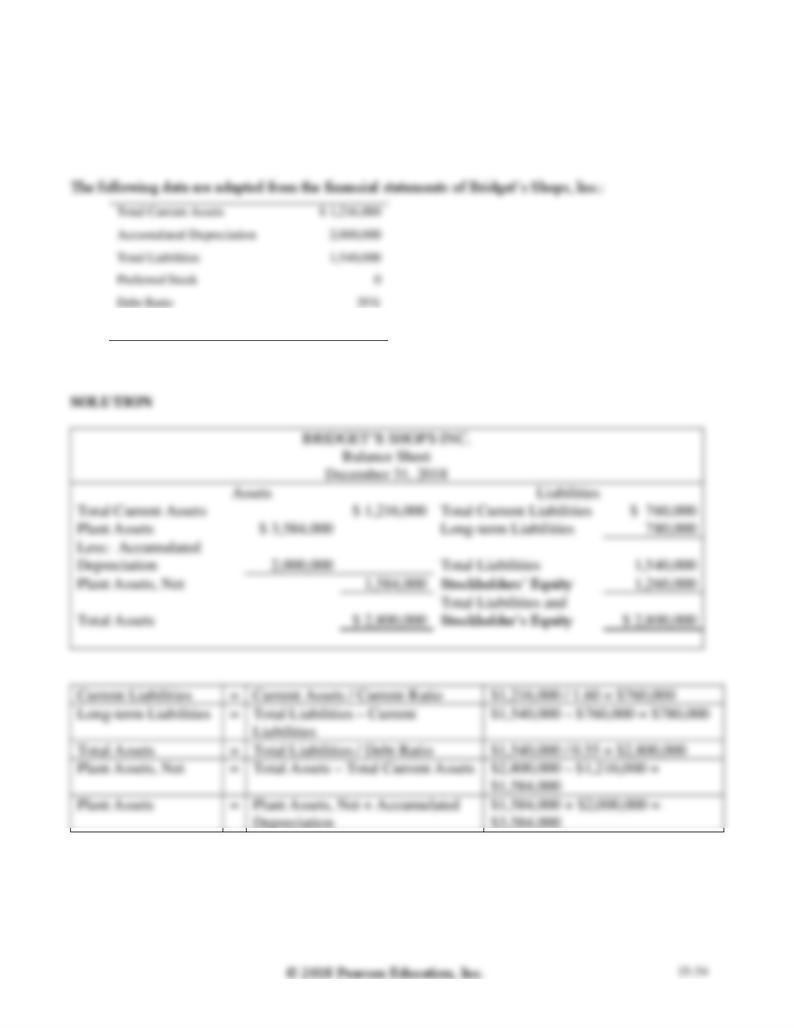
E15-22 Using ratios to reconstruct a balance sheet
Learning Objective 4
Total Assets $2,800,000
Current Ratio
1.60
Prepare Bridget’s condensed balance sheet as of December 31, 2018.
Problems (Group A)
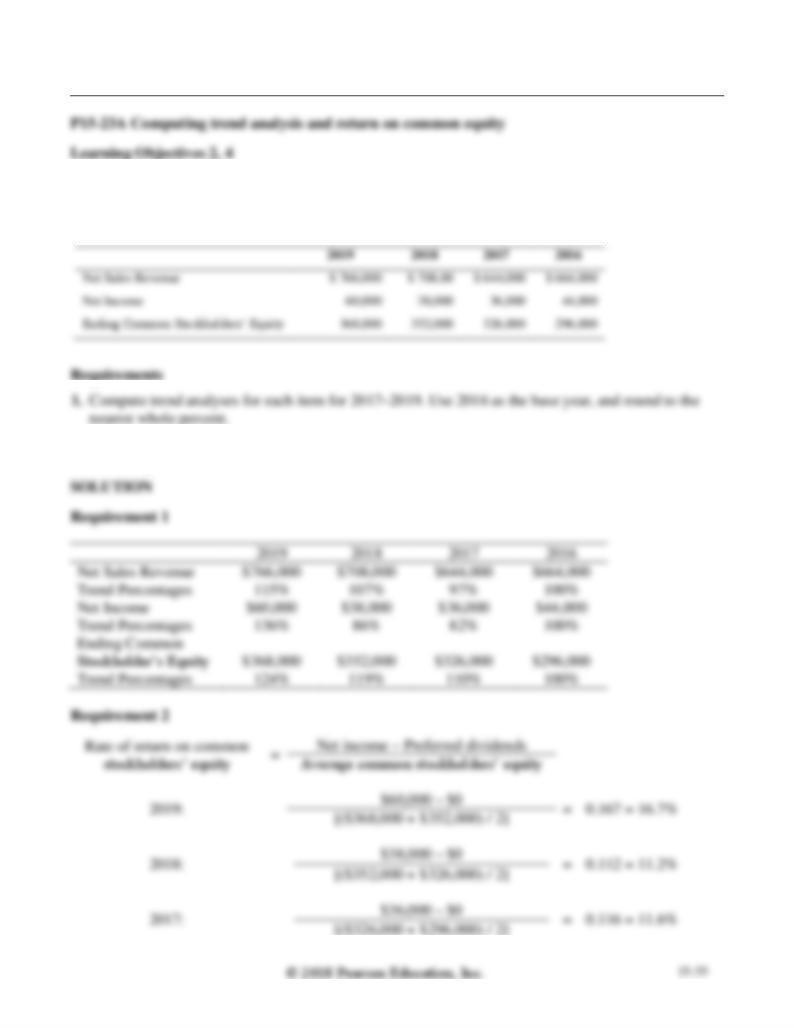
2. 2019: 16.7%
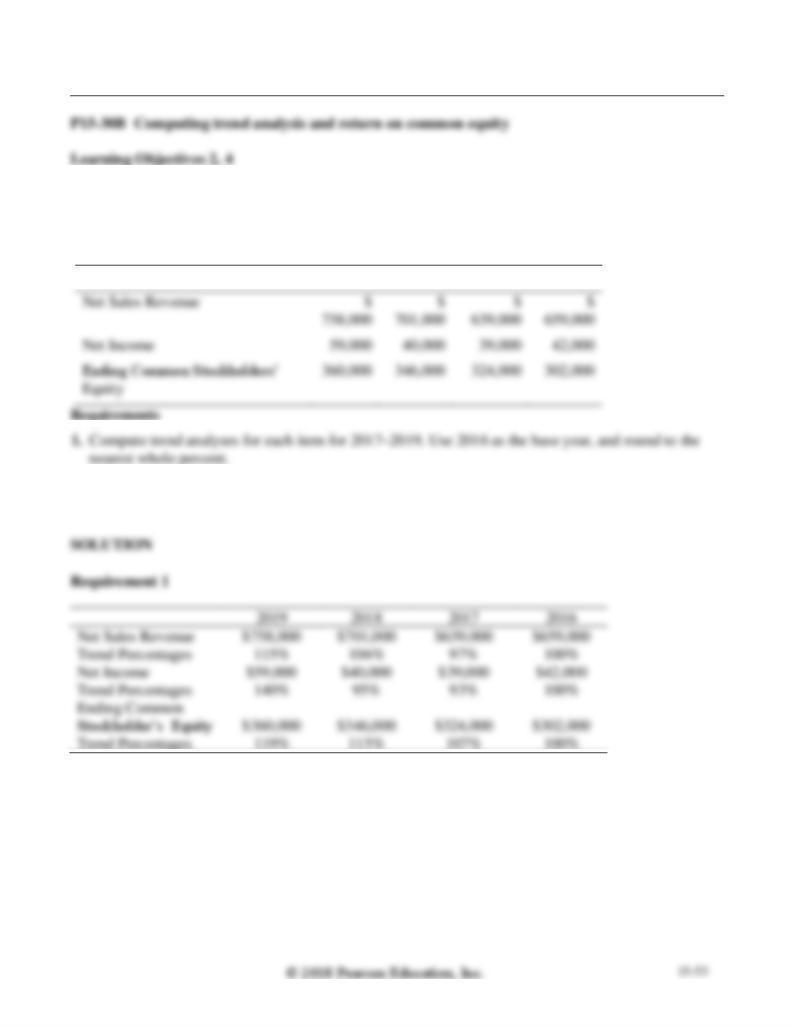
Net sales revenue, net income, and common stockholders’ equity for Eyesight Mission Corporation, a
manufacturer of contact lenses, follow for a four-year period.
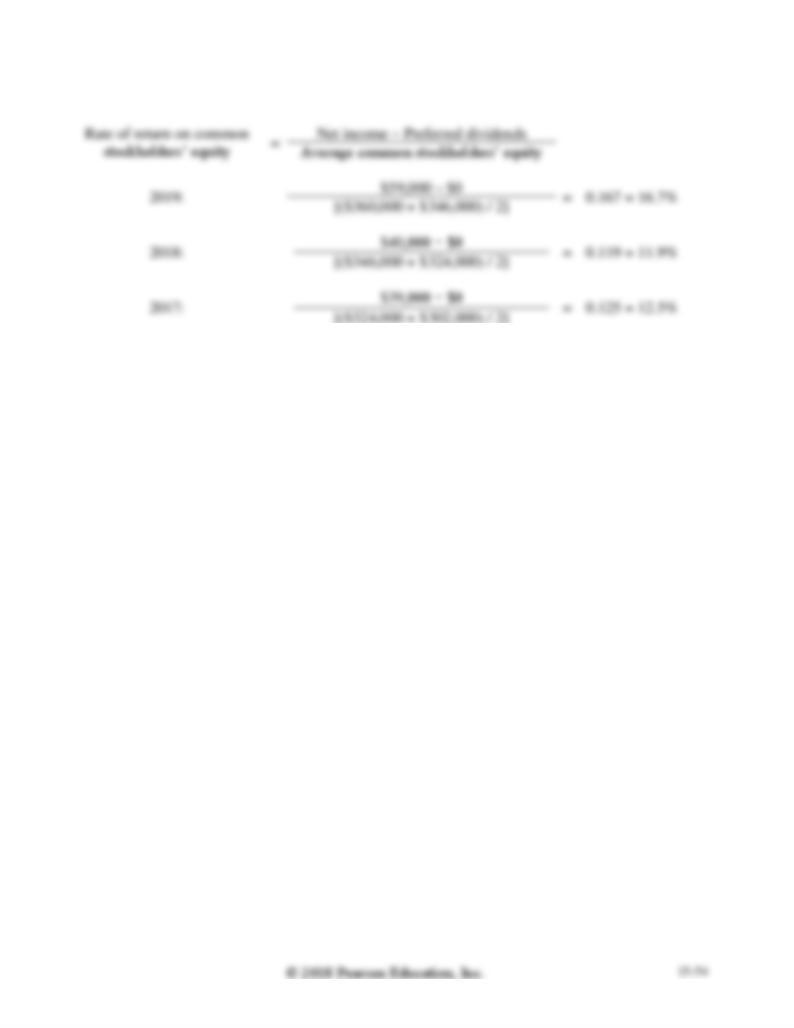
2. Compute the rate of return on common stockholders’ equity for 2017–2019, rounding to three
decimal places.
Note: Problem P15-24A must be completed before attempting Problem P15-25A.
1. Net Income 11.3%
P15-24A, cont.
Net Income
$ 87,914
11.3
%
Total Liabilities and Stockholders’ Equity
$ 500,000
100.0
%
Requirement 2
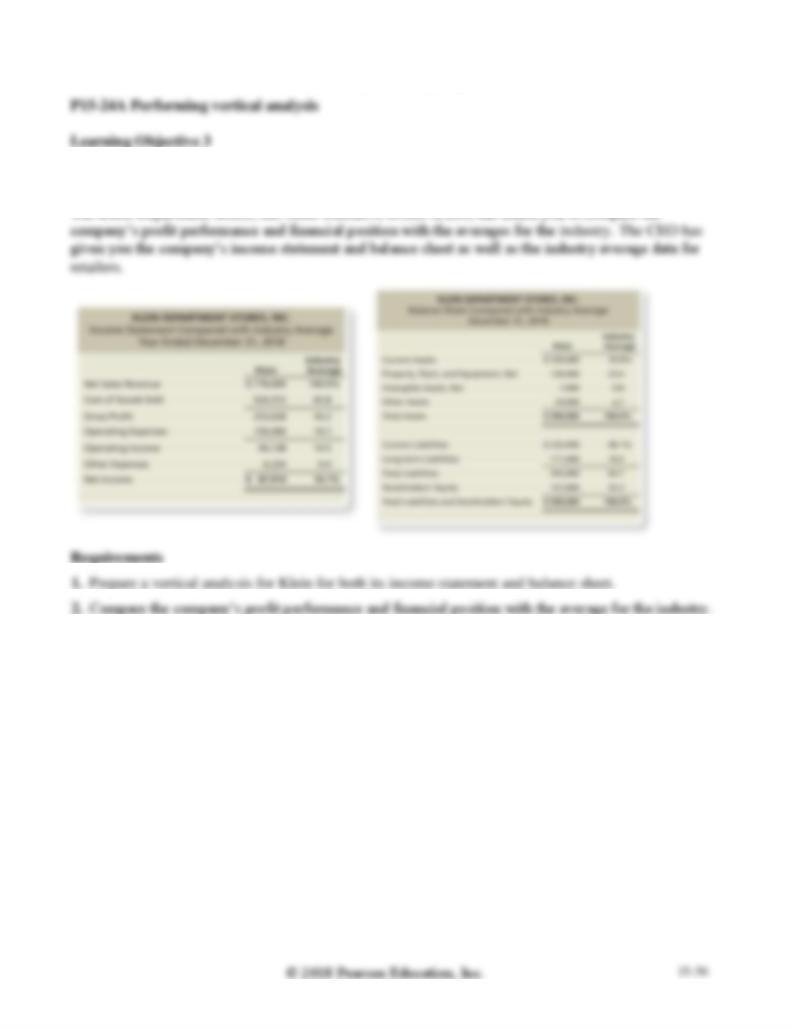
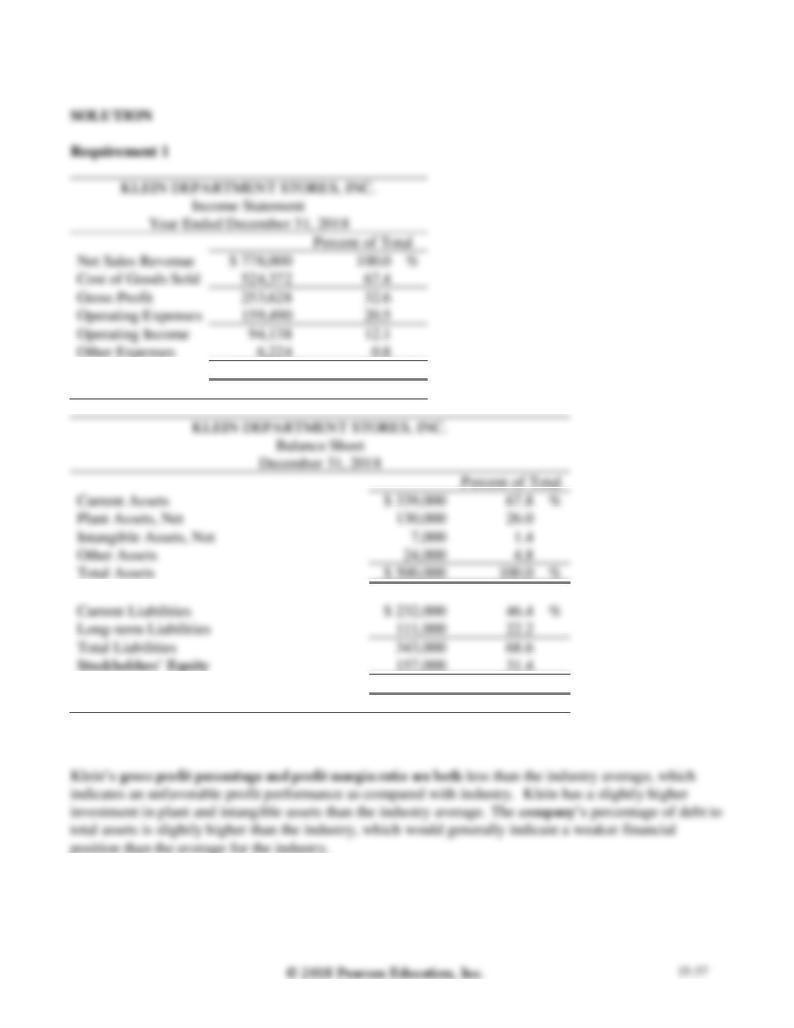
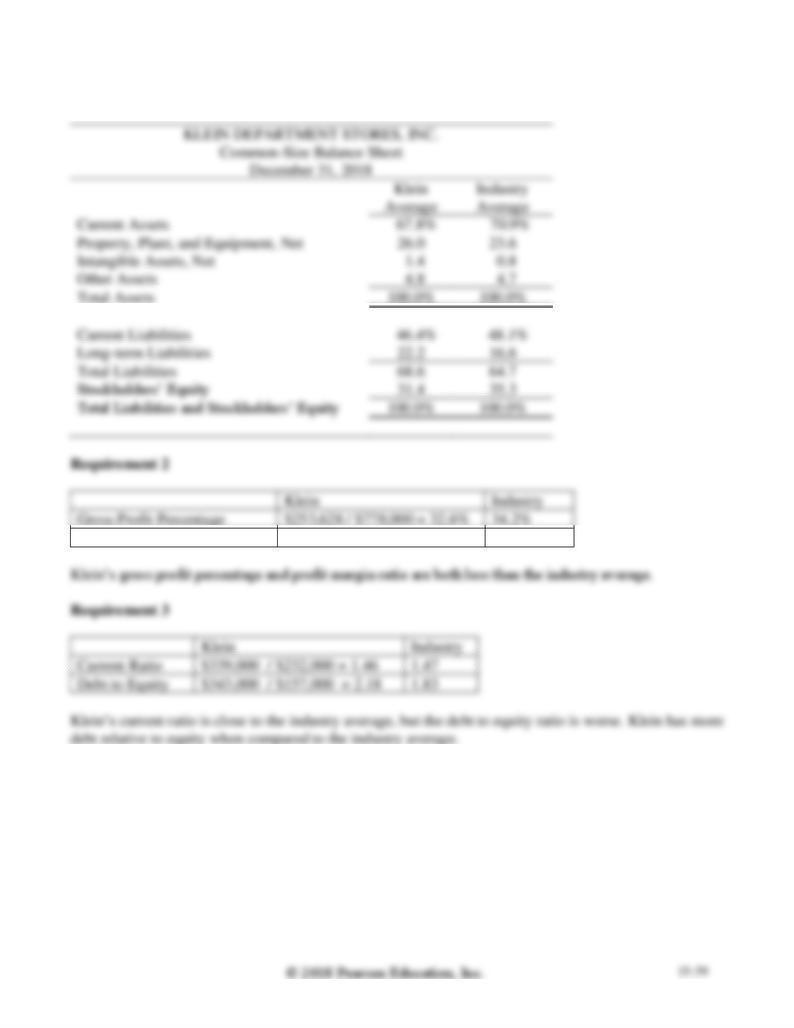
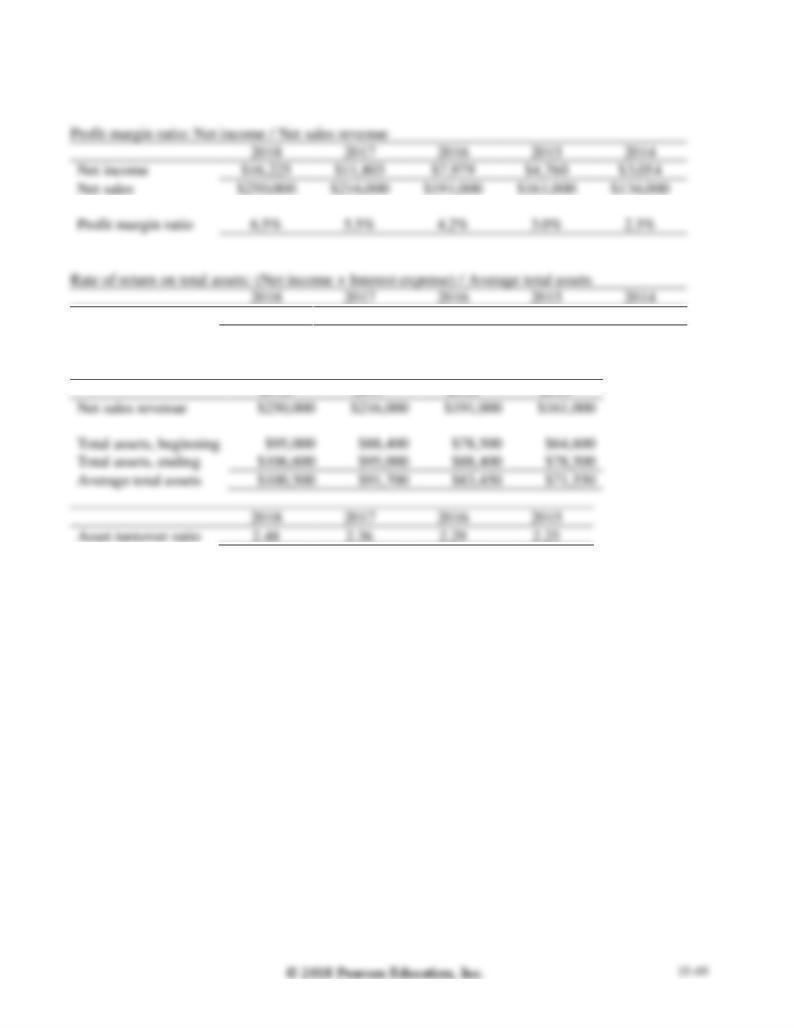
2. For the profitability analysis, compute Klein’s (a) gross profit percentage and (b) profit margin ratio.
Compare these figures with the industry averages. Is Klein’s profit performance better or worse than
the industry average?
3. For the analysis of financial position, compute Klein’s (a) current ratio and (b) debt to equity ratio.
Compare these ratios with the industry averages. Assume the current ratio industry average is 1.47,
and the debt to equity industry average is 1.83. Is Klein’s financial position better or worse than the
industry averages?
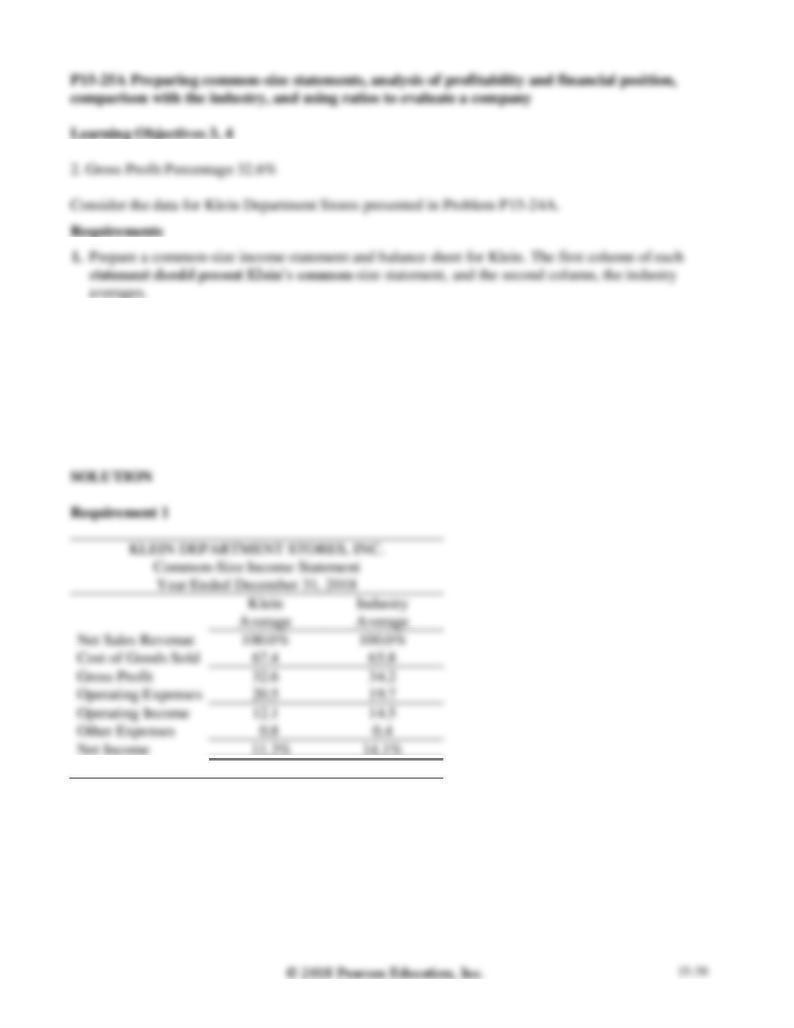
P15-25A, cont.
Requirement 1, cont.
Profit Margin Ratio
$87,914 / $778,000 = 11.3%
14.1%
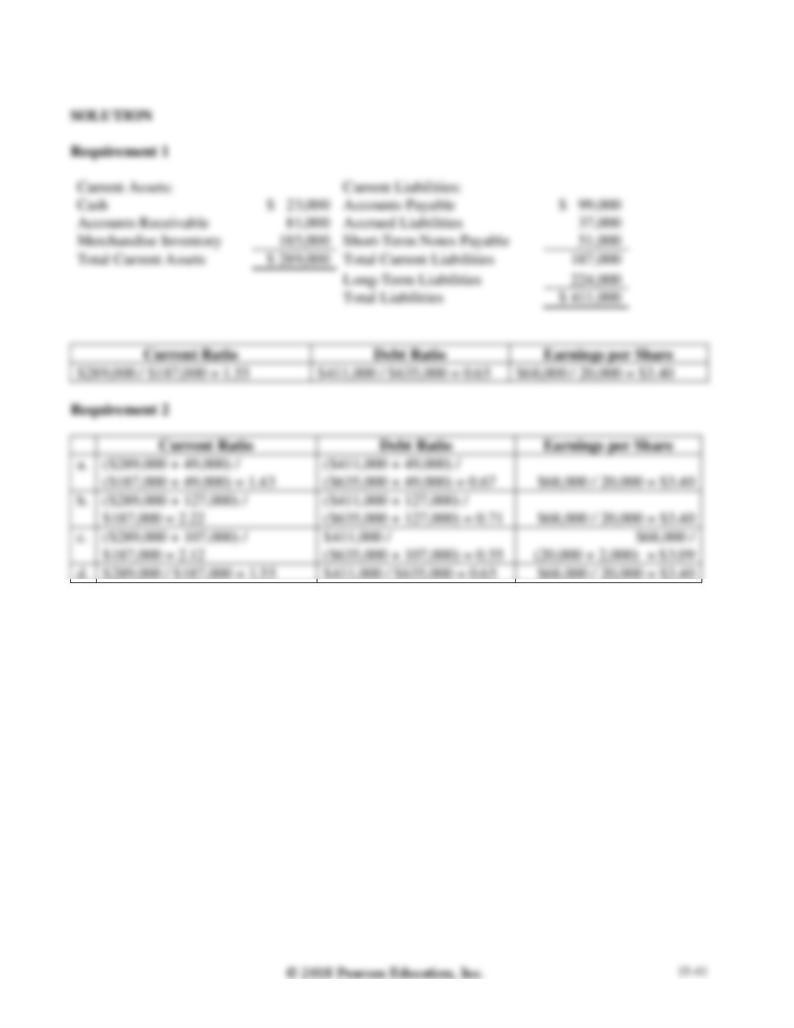
1. Current Ratio 1.55
Financial statement data of Style Traveler Magazine include the following items:
Cash
$ 23,000
Accounts Receivable, Net
81,000
Merchandise Inventory
185,000
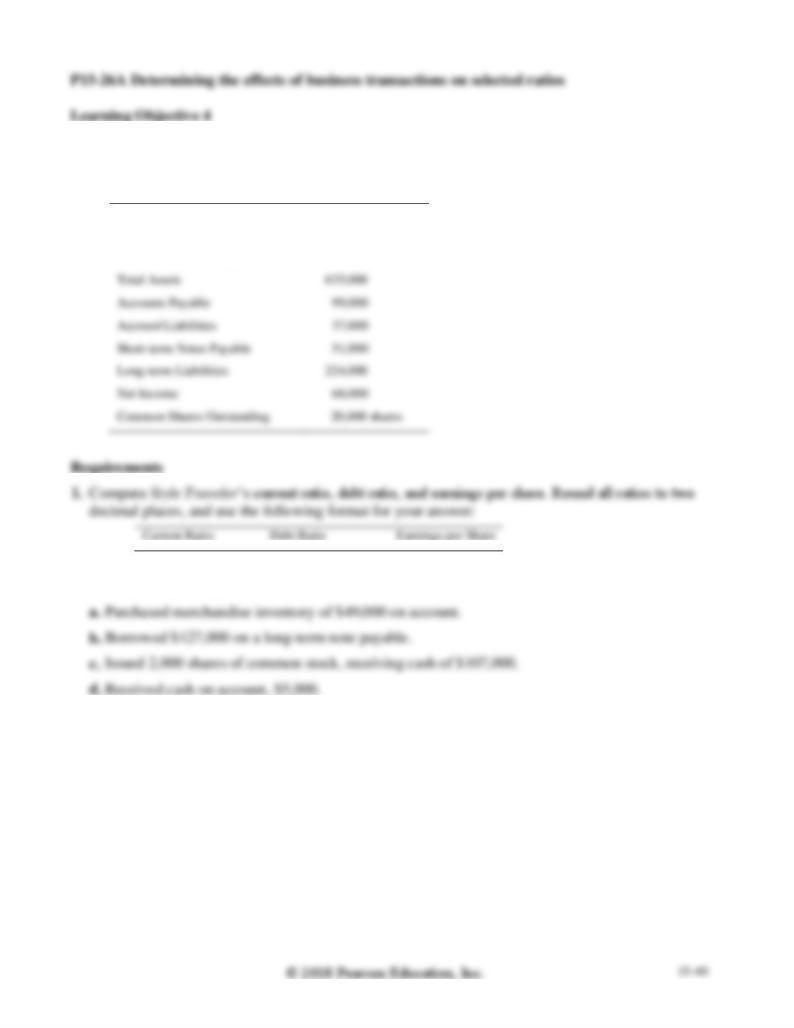
2. Compute the three ratios after evaluating the effect of each transaction that follows. Consider each
transaction separately.
P15-26A cont.
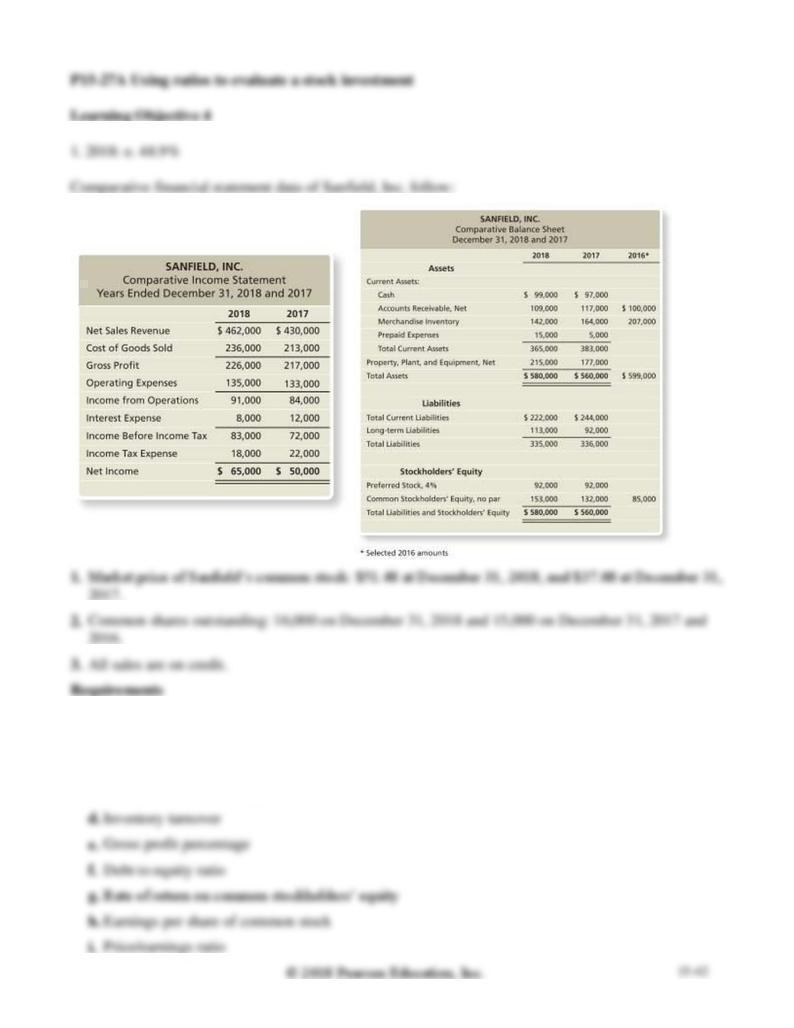
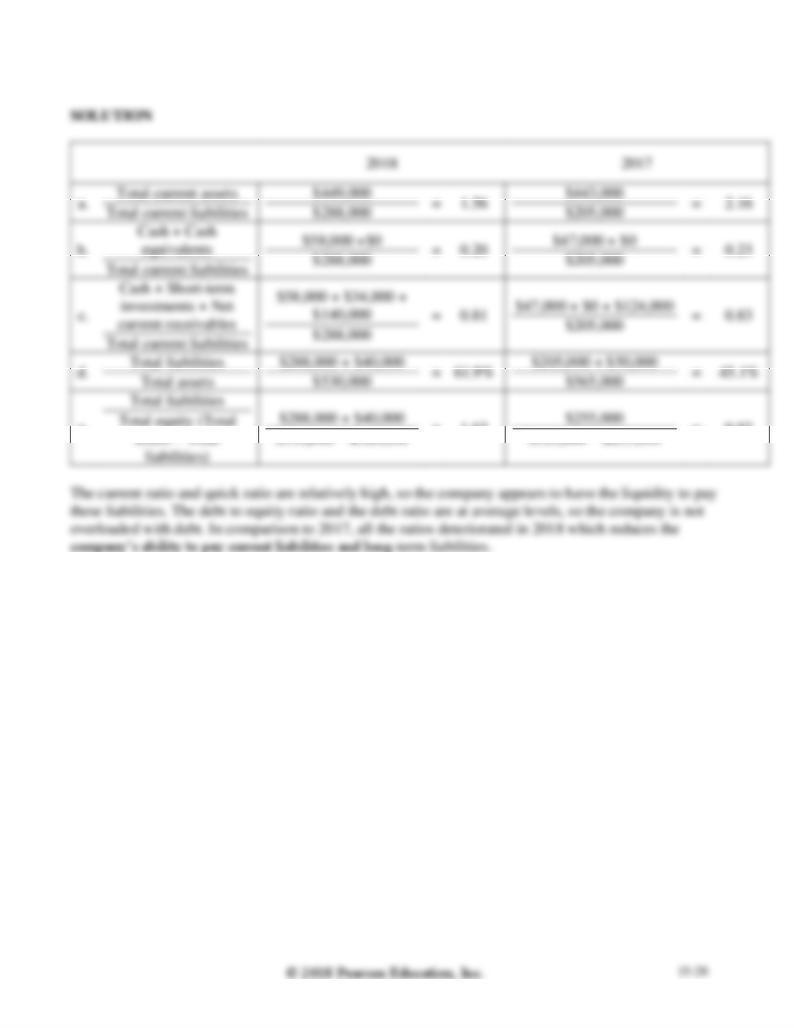
1. Compute the following ratios for 2018 and 2017:
a. Current ratio
b. Cash ratio
c. Times-interest-earned ratio
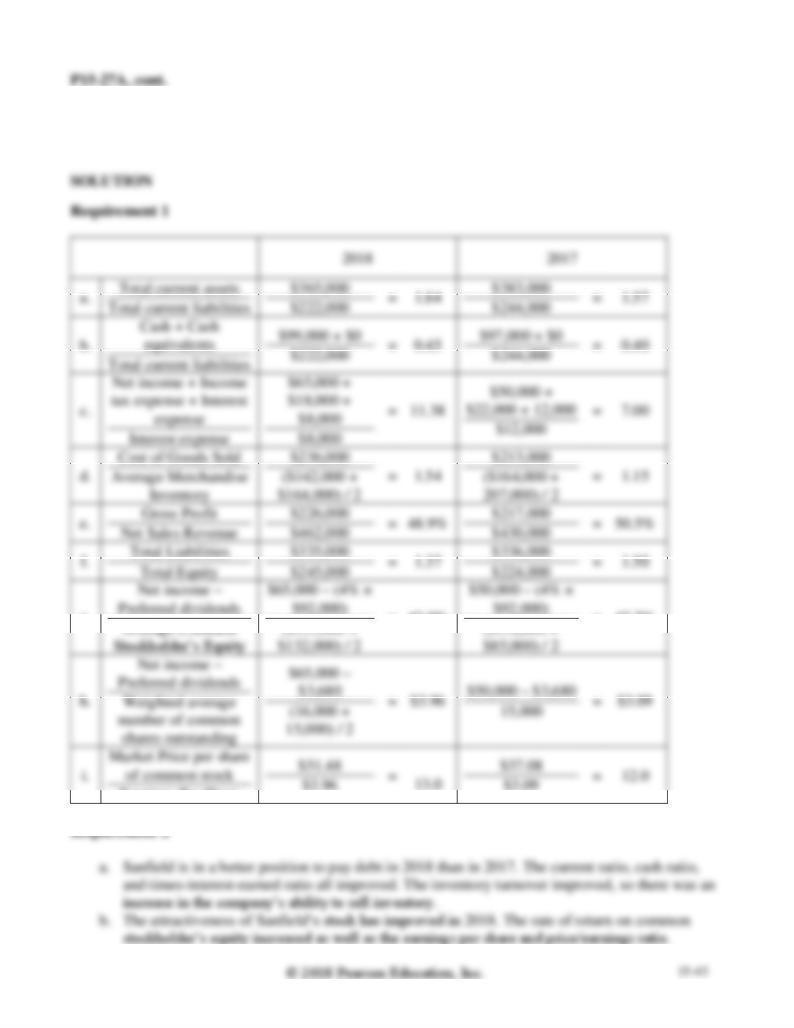
2. Decide (a) whether Sanfield’s ability to pay debts and to sell inventory improved or deteriorated
during 2018 and (b) whether the investment attractiveness of its common stock appears to have
increased or decreased.
b.
=
0.45
=
0.40
g.
=
43.0%
=
42.7%
Earnings Per Share
$3.96
$3.09
1. Digitalized e. $4.25
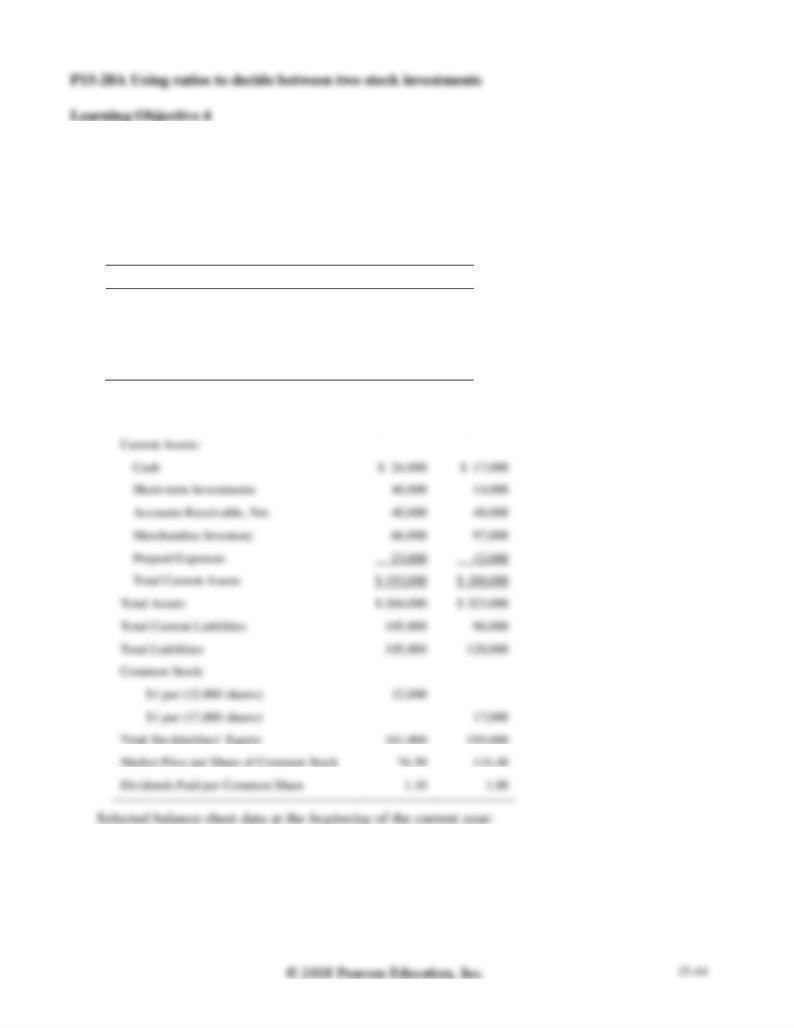
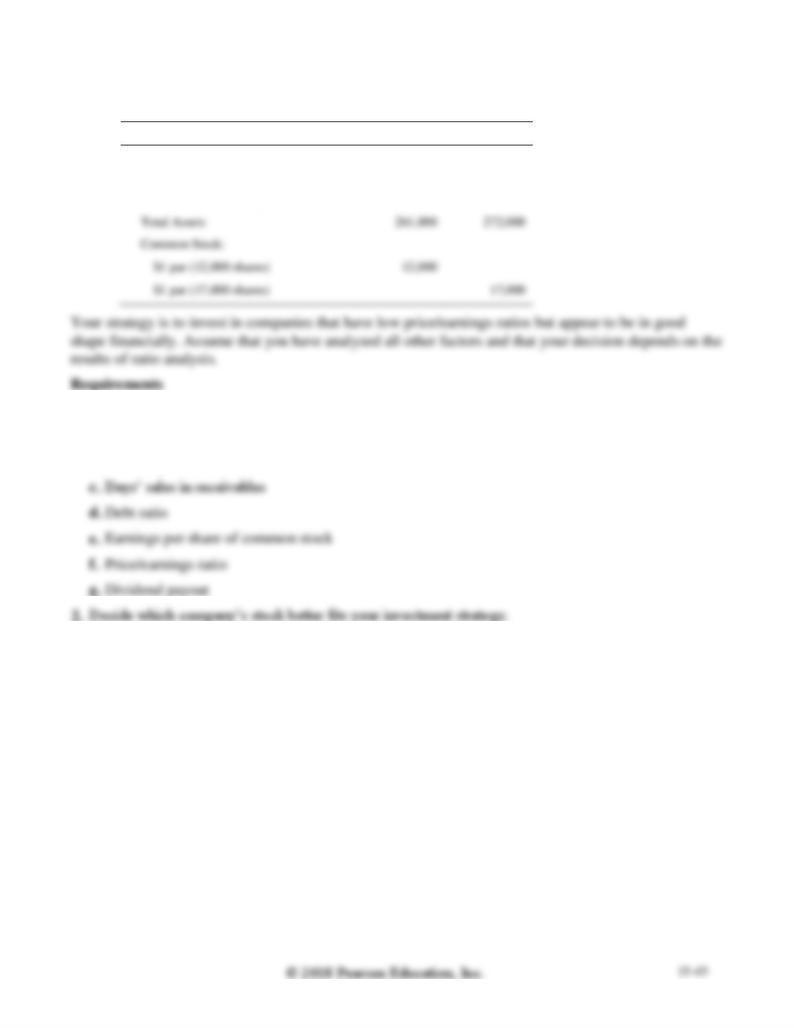
Assume that you are purchasing an investment and have decided to invest in a company in the digital
phone business. You have narrowed the choice to Digitalized Corp. and Every Zone, Inc. and have
assembled the following data.
Selected income statement data for the current year:
Digitalized
Every Zone
Net Sales Revenue (all on credit)
$ 423,035
$ 493,845
Cost of Goods Sold
210,000
260,000
Interest Expense
0
19,000
Net Income
51,000
72,000
Selected balance sheet and market price data at the end of the current year:
Digitalized
Every Zone
P15-28A, cont.
Digitalized
Every Zone
Balance Sheet:
Accounts Receivable, net
$ 41,000
$ 54,000
Merchandise Inventory
81,000
87,000
1. Compute the following ratios for both companies for the current year:
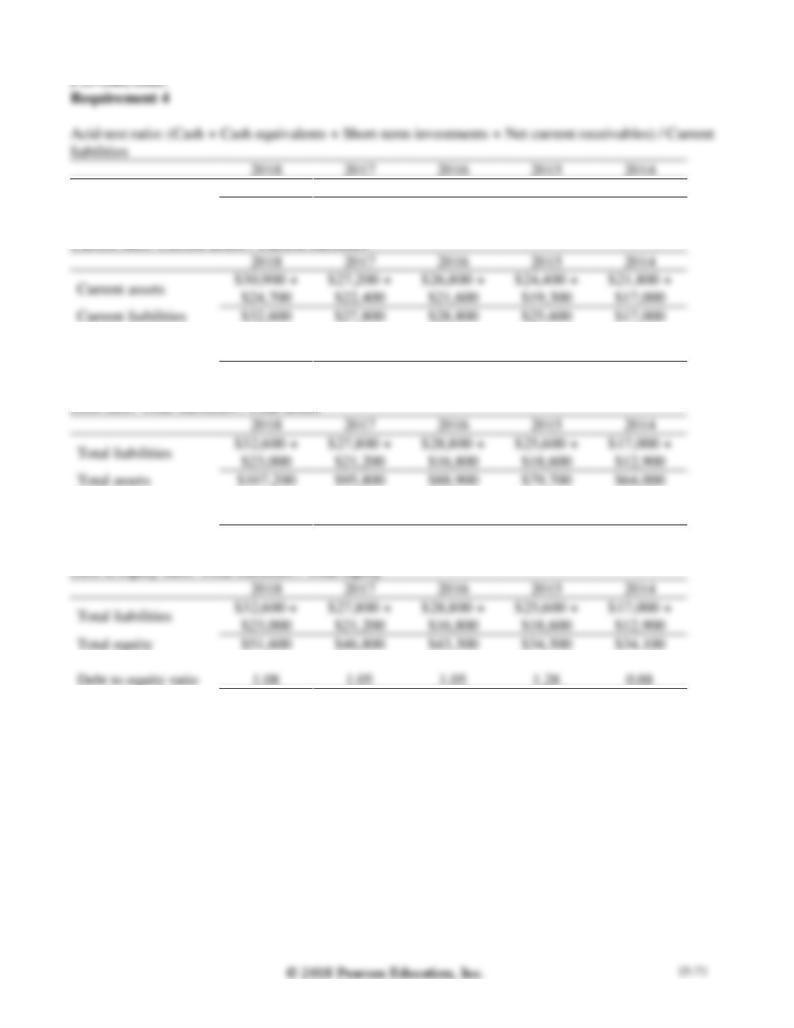
a. Acid-test ratio
b. Inventory turnover
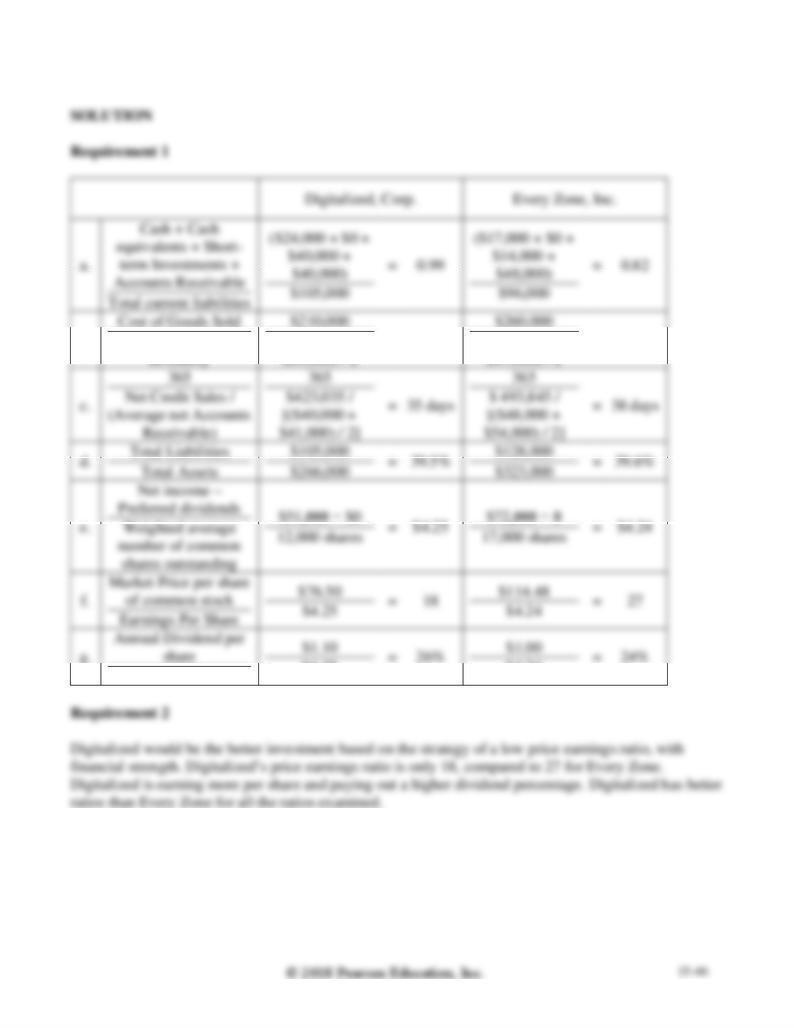
P15-28A, cont.
b.
Average Merchandise
($66,000 +
=
2.86
($97,000 +
=
2.83
Earnings Per Share
$4.25
$4.24
3. 2018: Inventory turnover 8.04
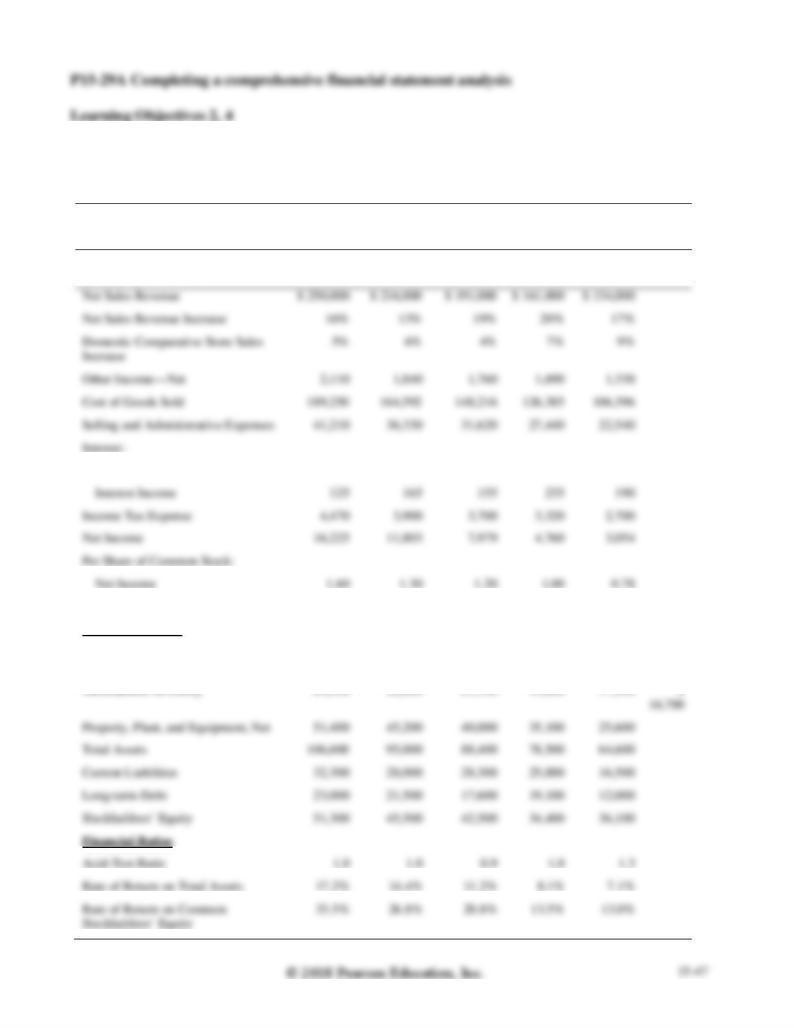
In its annual report, ABC Athletic Supply, Inc. includes the following five-year financial summary:
ABC ATHLETIC SUPPLY, INC.
Five-Year Financial Summary (Partial; adapted)
(Dollar amounts in thousands
except per share data)
2018
2017
2016
2015
2014
2013
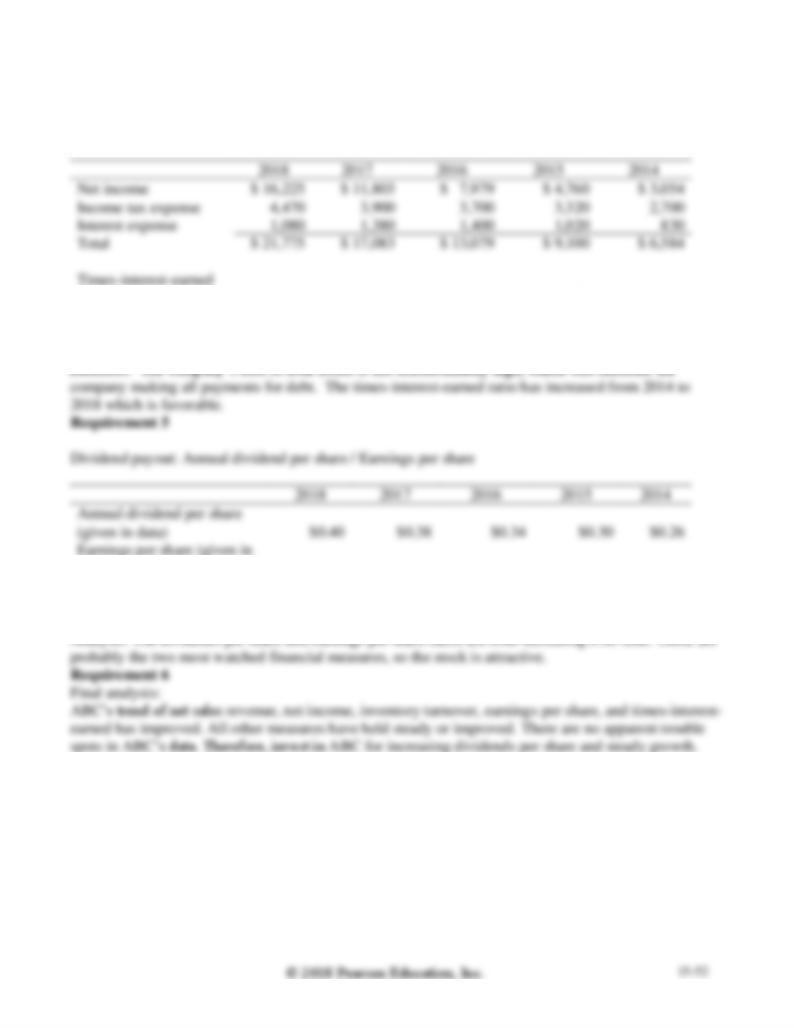
Interest Expense
(1,080)
(1,380)
(1,400)
(1,020)
(830)
Dividends
0.40
0.38
0.34
0.30
0.26
Financial Position
Current Assets, Excluding
Merchandise Inventory
$ 30,700
$ 27,200
$ 26,700
$ 24,400
$ 21,500
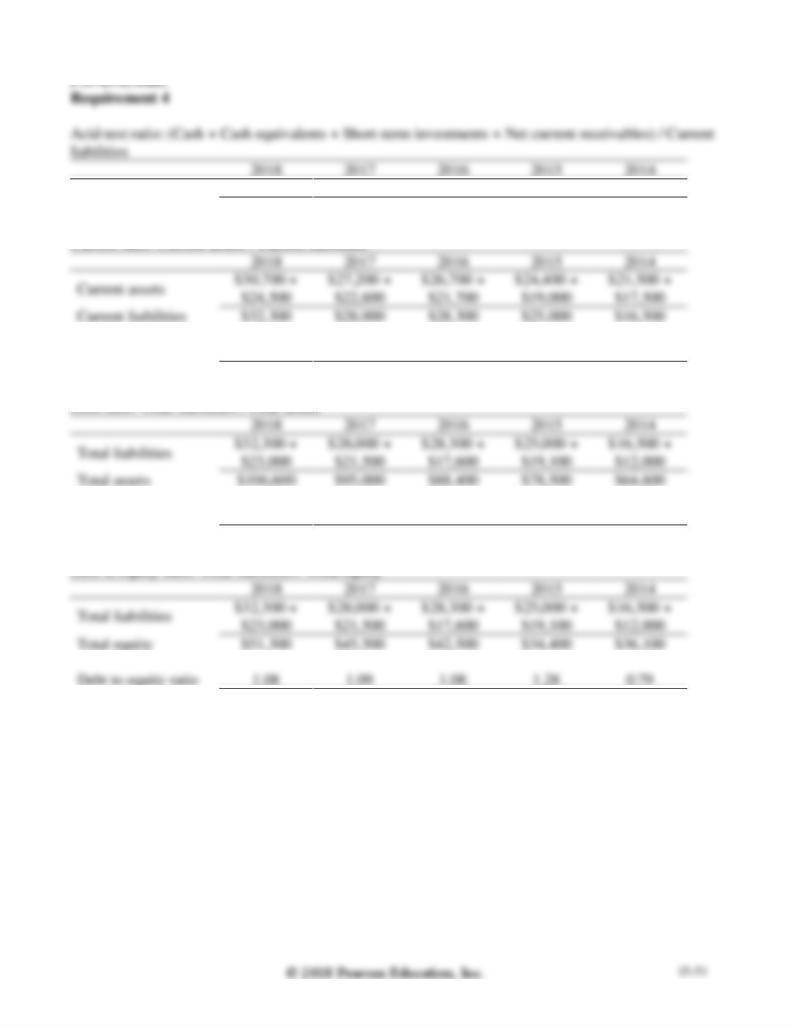
P15-29A, cont.
6. Should you invest in the common stock of ABC Athletic Supply, Inc.? Fully explain your final
decision
P15-29A, cont.
Requirement 2
Given in data
17.2%
14.4%
11.2%
8.1%
7.1%
Asset turnover ratio: Net sales revenue / Average total assets
Given in data
33.5%
26.8%
20.8%
13.5%
13.0%
Given in data
$1.60
$1.30
$1.20
$1.00
$0.78
Analysis: The profit margin ratio, return on assets, asset turnover ratio, and return on equity are
increasing over the five years examined. The return on assets and the return on equity are both very
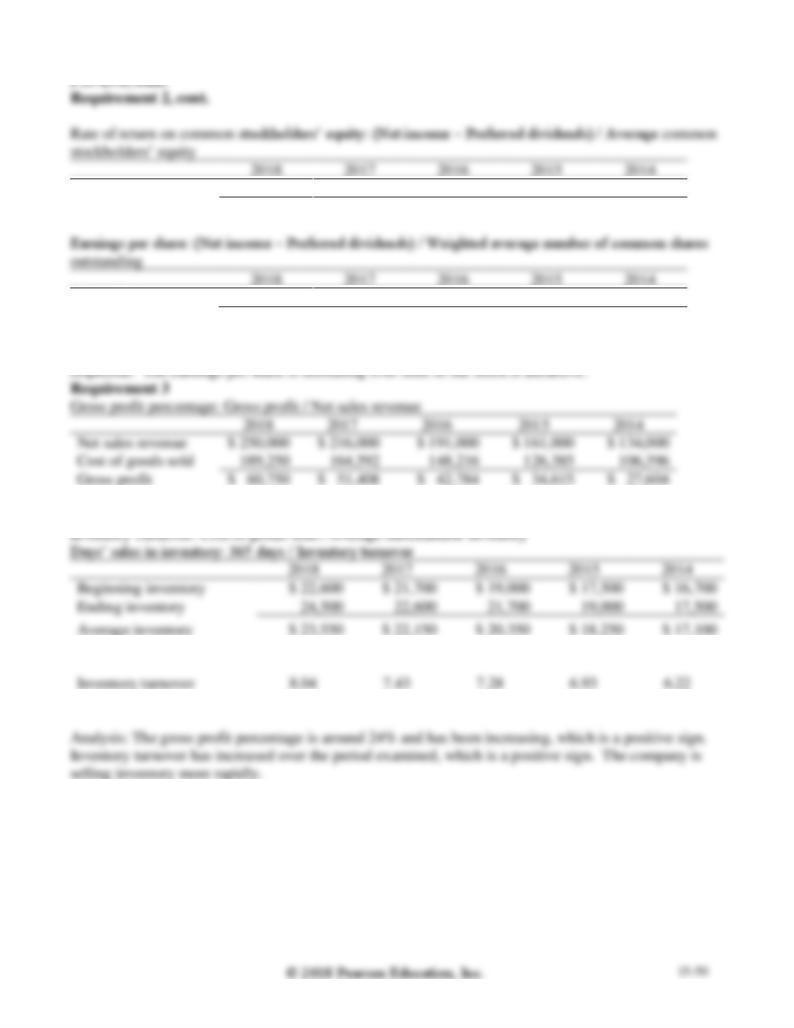
Gross profit %
24.3%
23.8%
22.4%
21.5%
20.6%
Days’ sales in inventory
45.4 days
49.1 days
50.1 days
52.7 days
58.7 days
Given in data
1.0
1.0
0.9
1.0
1.3
Current ratio: Current assets / Current liabilities
Current ratio
1.71
1.78
1.71
1.74
2.36
Debt ratio
51.9%
52.1%
51.9%
56.2%
44.1%
P15-29A, cont.
Requirement 4, cont.
Times interest earned ratio: (Net income + income tax expense + Interest expense) / Interest expense
ratio
20.16
12.38
9.34
8.92
7.93
Analysis: The current and quick ratios are fairly high. This indicates that the company can pay its
data)
$1.60
$1.30
$1.20
$1.00
$0.78
Dividend payout
25%
29%
28%
30%
33%
Problems (Group B)
2. 2018: 11.9%
Net sales revenue, net income, and common stockholders’ equity for Azbel Mission Corporation, a
manufacturer of contact lenses, follow for a four-year period.
2019
2018
2017
2016
2. Compute the rate of return on common stockholders’ equity for 2017–2019, rounding to three
decimal places.
P15-30B, cont.
Requirement 2
1. Net Income 10.9%
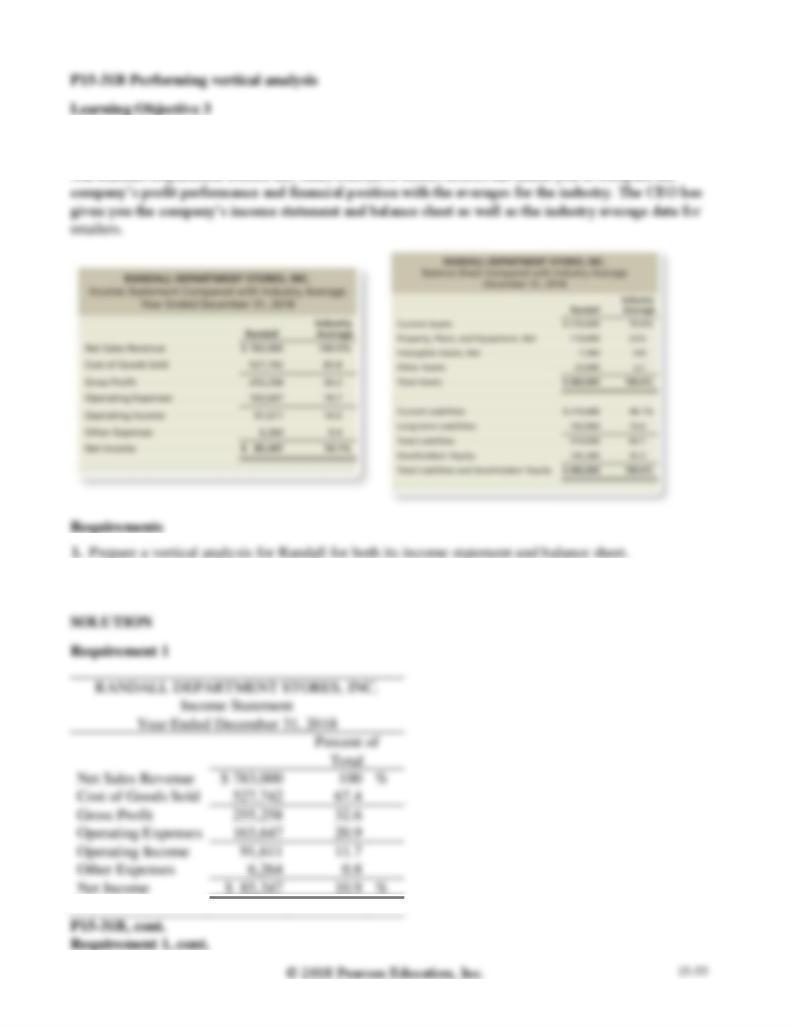
2. Compare the company’s profit performance and financial position with the average for the industry.
Total Liabilities and Stockholders’ Equity
$460,000
100.0
%
Requirement 2
Note: Problem P15-31B must be completed before attempting Problem P15-32B.
2. For the profitability analysis, compute Randall’s (a) gross profit percentage and (b) profit margin
ratio. Compare these figures with the industry averages. Is Randall’s profit performance better or
worse than the industry average?
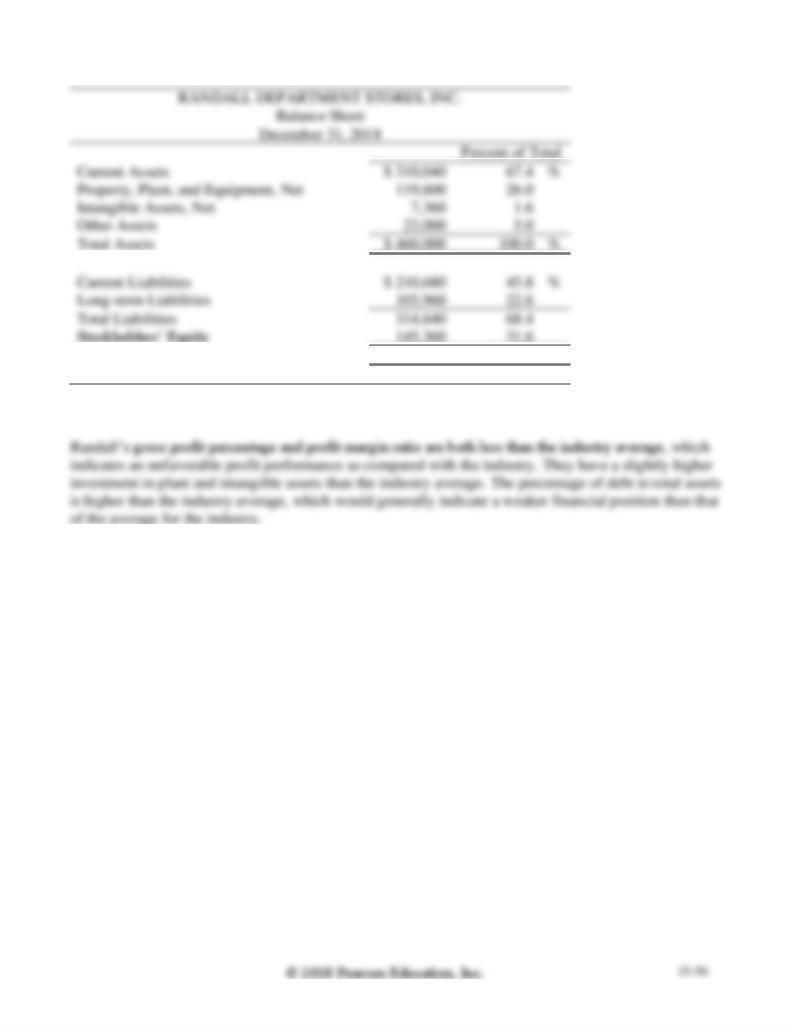
3. For the analysis of financial position, compute Randall’s (a) current ratio and (b) debt to equity ratio.
Compare these ratios with the industry averages. Assume the current ratio industry average is 1.47,
and the debt to equity industry average is 1.83. Is Randall’s financial position better or worse than the
industry averages?
P15-32B, cont.
Requirement 1, cont.
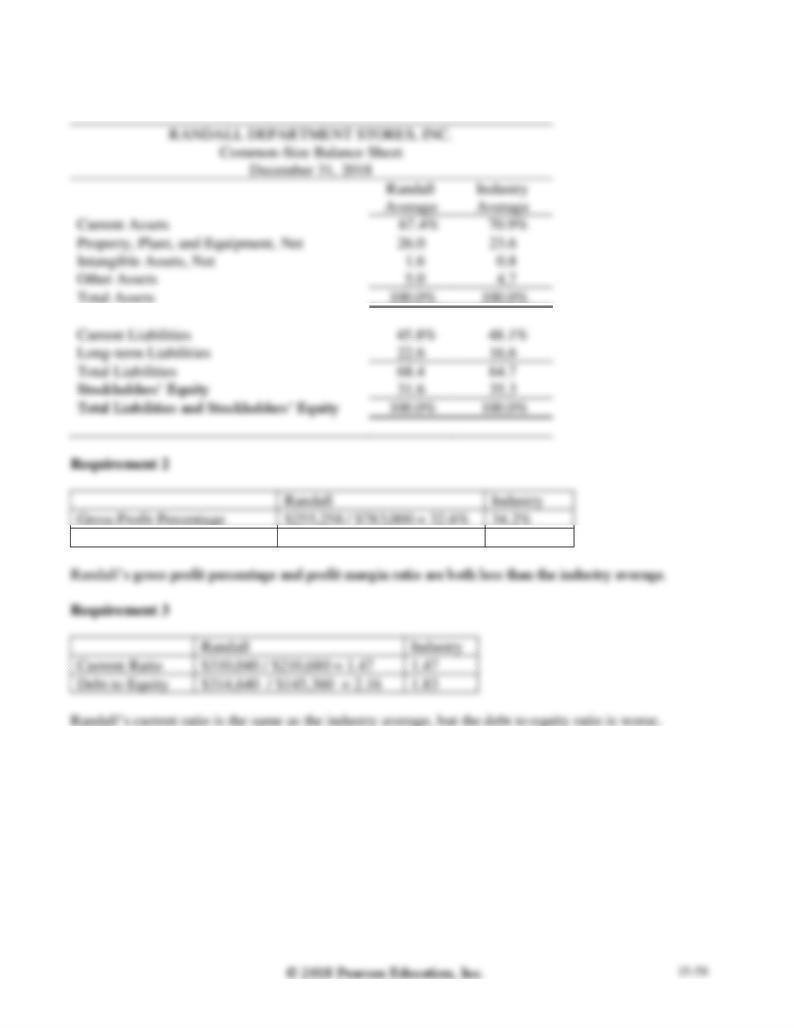
Profit Margin Ratio
$85,347 / $783,000 = 10.9%
14.1%
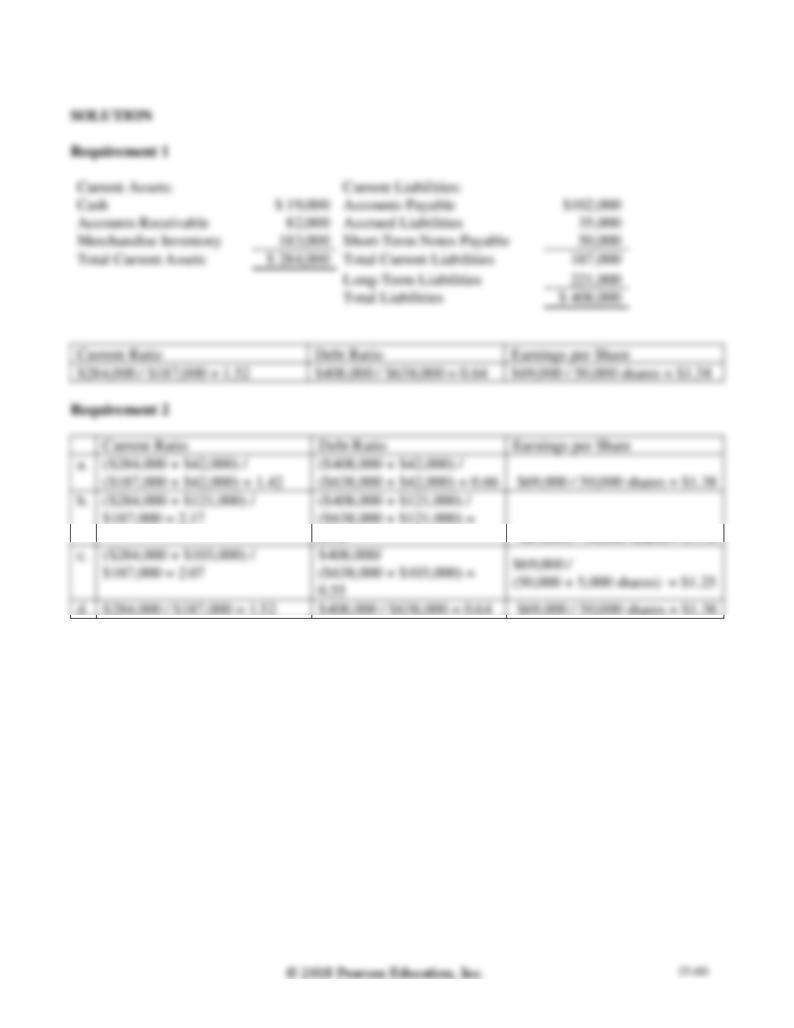
1. Earnings per Share $1.38
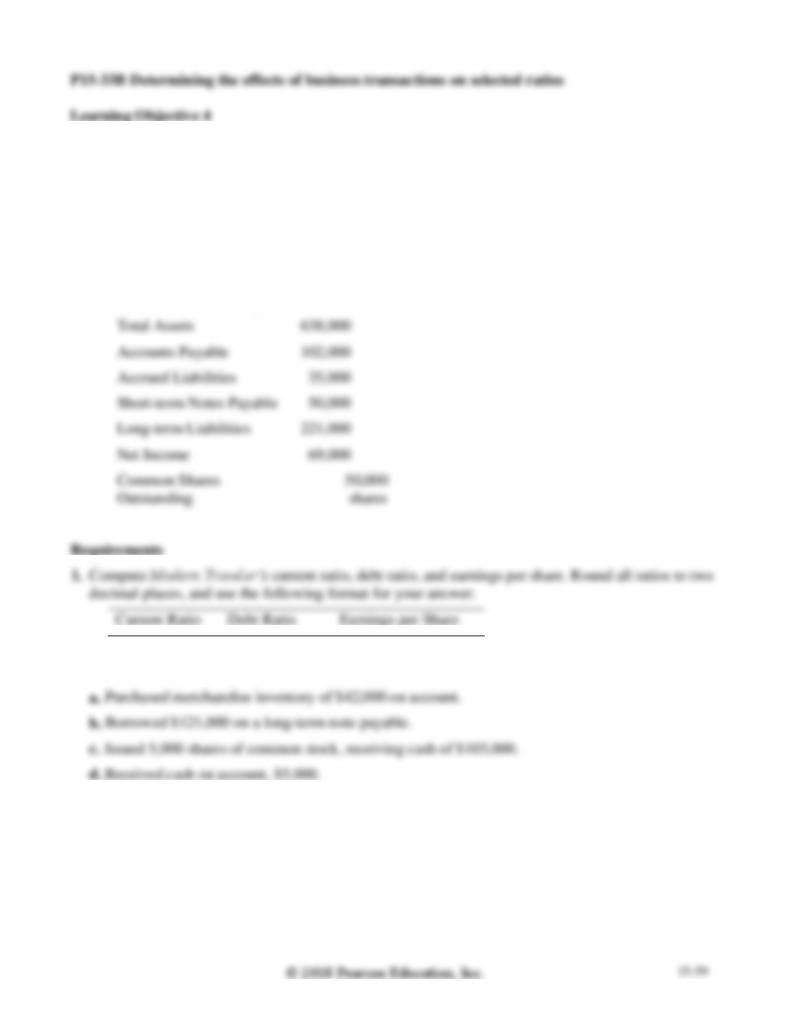
Financial statement data of Modern Traveler’s Magazine include the following items:
Cash
$
19,000
Accounts Receivable,
Net
82,000
Merchandise Inventory
183,000
2. Compute the three ratios after evaluating the effect of each transaction that follows. Consider each
transaction separately.
P15-33B, cont.
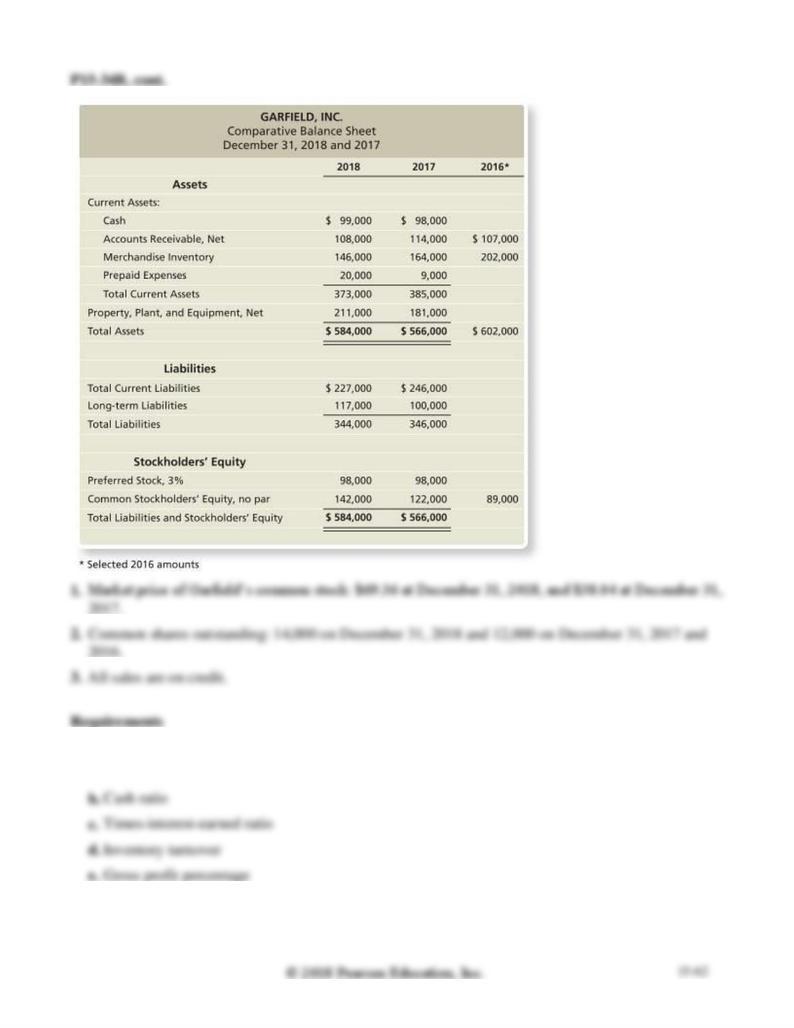
1. Compute the following ratios for 2018 and 2017:
a. Current ratio
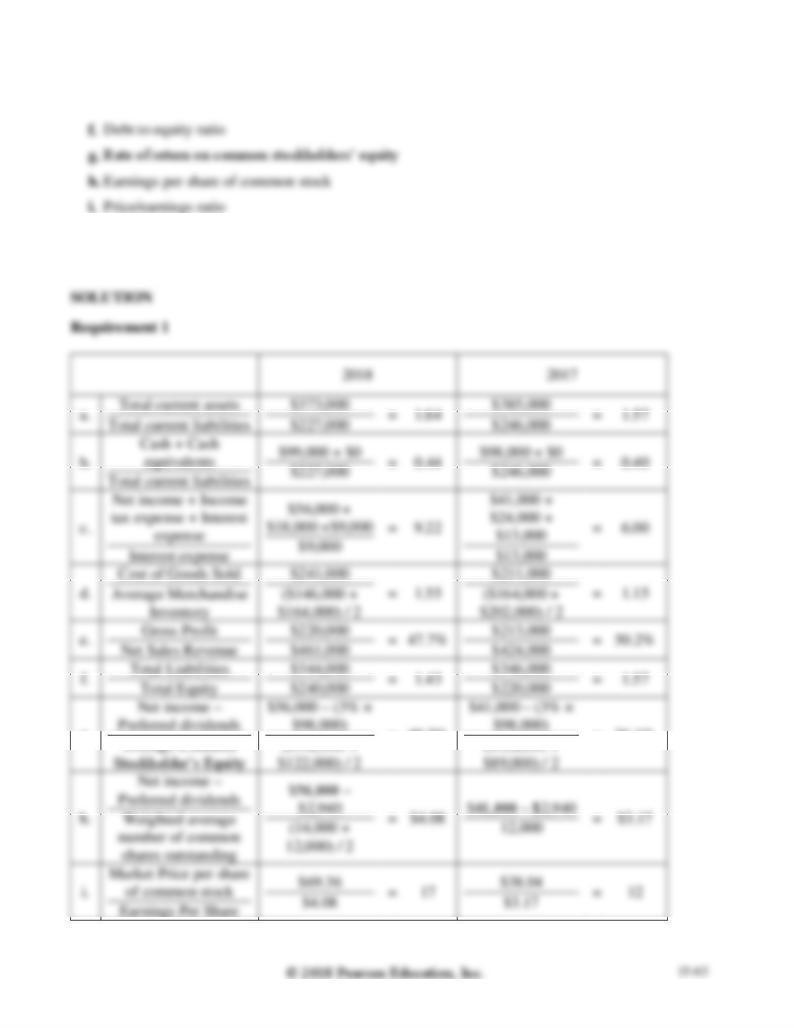
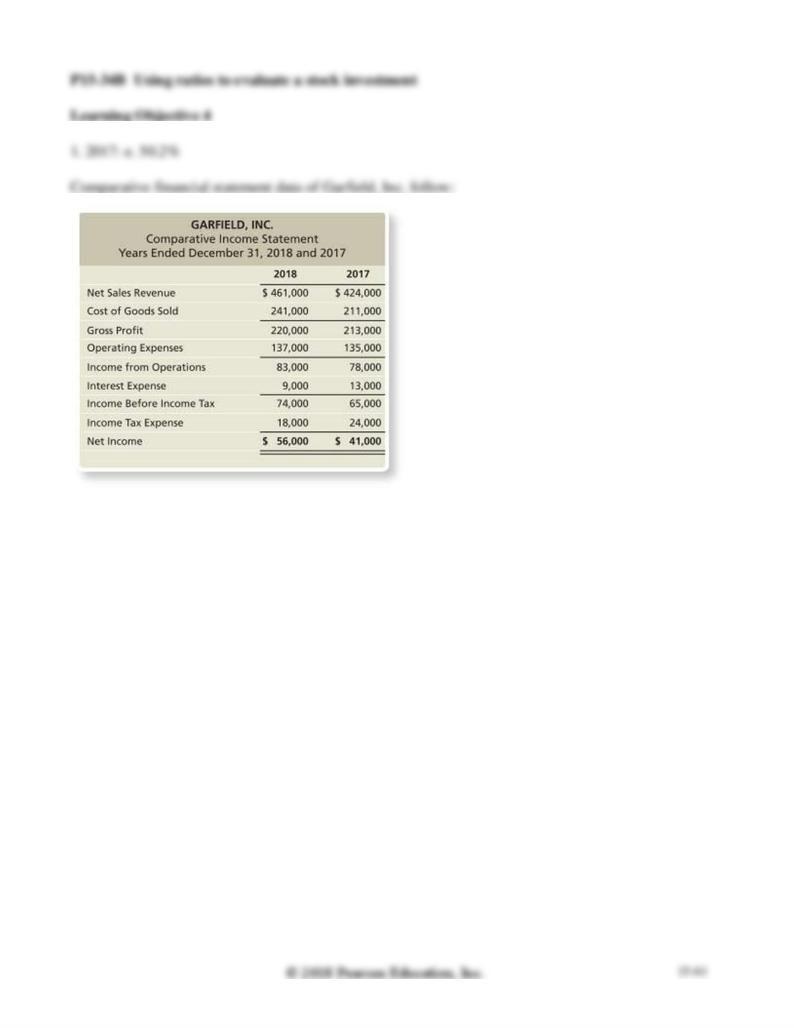
P15-34B . cont.
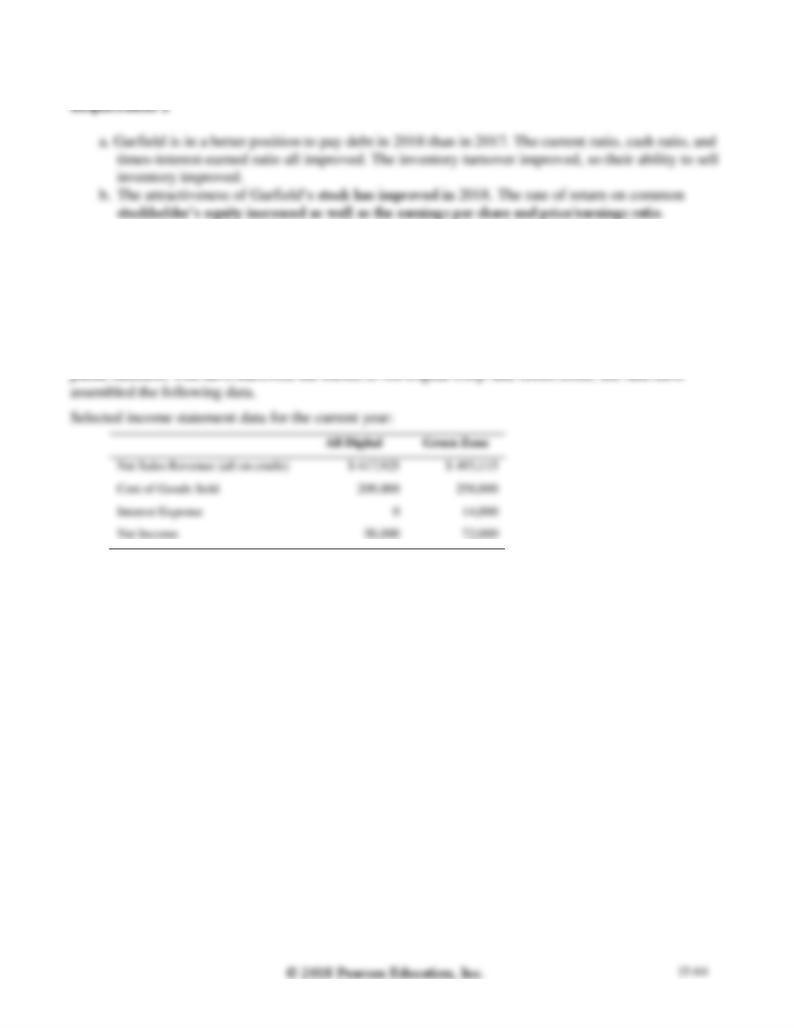
2. Decide (a) whether Garfield’s ability to pay debts and to sell inventory improved or deteriorated
during 2018 and (b) whether the investment attractiveness of its common stock appears to have
increased or decreased.
b.
=
0.44
=
0.40
g.
=
40.2%
=
36.1%
P15-34B . cont.
P15-35B Using ratios to decide between two stock investments
Learning Objective 4
1c. Green Zone 38 days
Assume that you are purchasing an investment and have decided to invest in a company in the digital
P15-35B, cont.
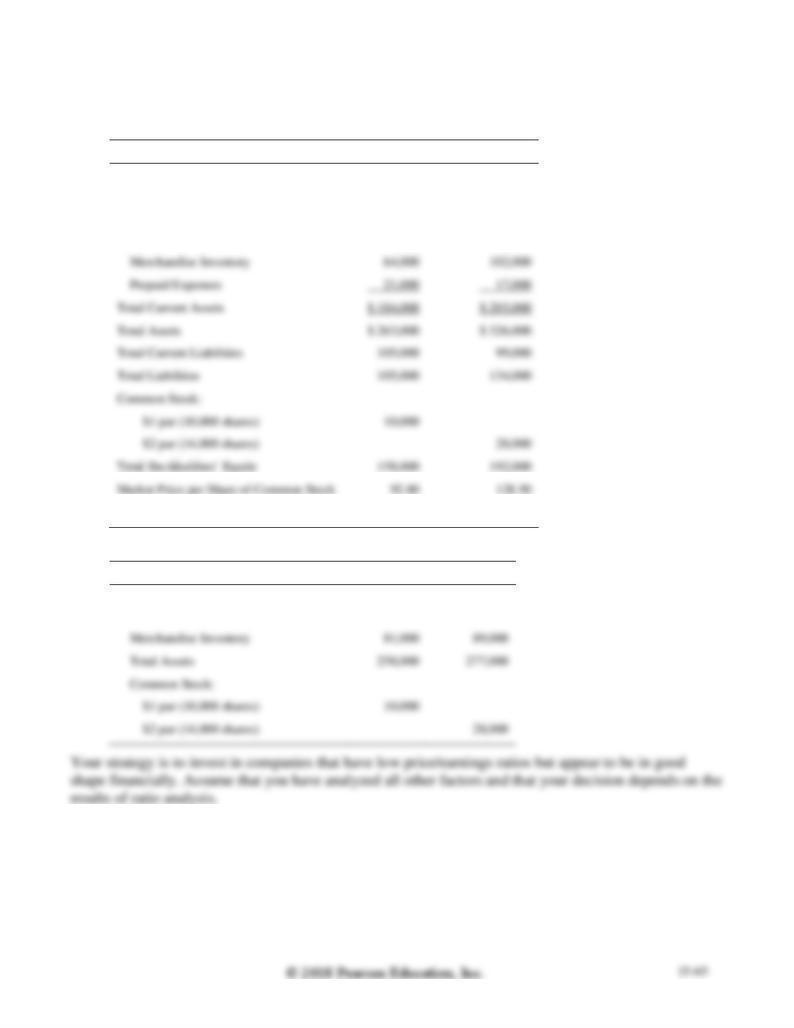
Selected balance sheet and market price data at the end of the current year:
All Digital
Green Zone
Current Assets:
Cash
$ 23,000
$ 18,000
Short-term Investments
37,000
17,000
Accounts Receivable, Net
39,000
49,000
Dividends Paid per Common Share
1.20
0.90
Selected balance sheet data at the beginning of the current year:
All Digital
Green Zone
Balance Sheet:
Accounts Receivable, Net
$ 41,000
$ 54 000
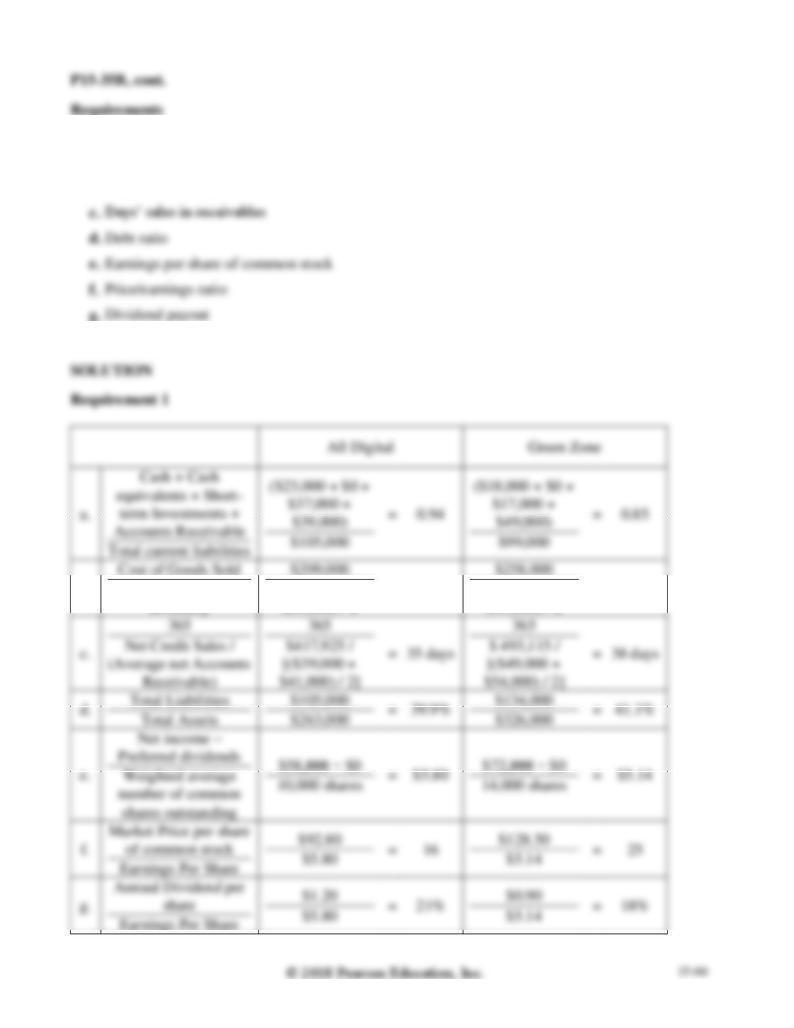
1. Compute the following ratios for both companies for the current year:
a. Acid-test ratio
b. Inventory turnover
2. Decide which company’s stock better fits your investment strategy.
b.
Average Merchandise
Inventory
($64,000 +
$81,000) / 2
=
2.88
($102,000 +
$89,000) / 2
=
2.70
P15-35B, cont.
Requirement 2
3. 2018: Inventory turnover 8.86
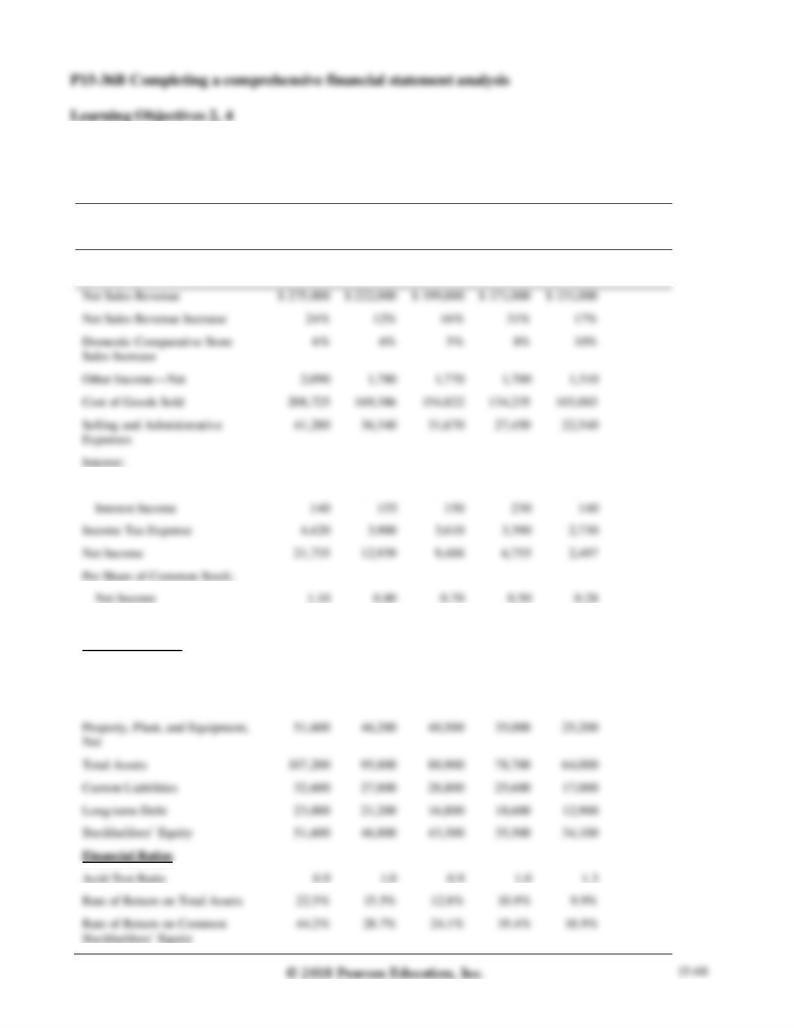
In its annual report, XYZ Athletic Supply, Inc. includes the following five-year financial summary:
XYZ ATHLETIC SUPPLY, INC.
Five-Year Financial Summary (Partial; adapted)
(Dollar amounts in thousands
except per share data)
2018
2017
2016
2015
2014
2013
Interest Expense
(1,070)
(1,370)
(1,330)
(1,100)
(800)
Dividends
0.45
0.43
0.39
0.35
0.31
Financial Position
Current Assets, Excluding
Merchandise Inventory
$ 30,900
$ 27,200
$ 26,800
$ 24,400
$ 21,800
Merchandise Inventory
24,700
22,400
21,600
19,300
17,000
$ 16,800
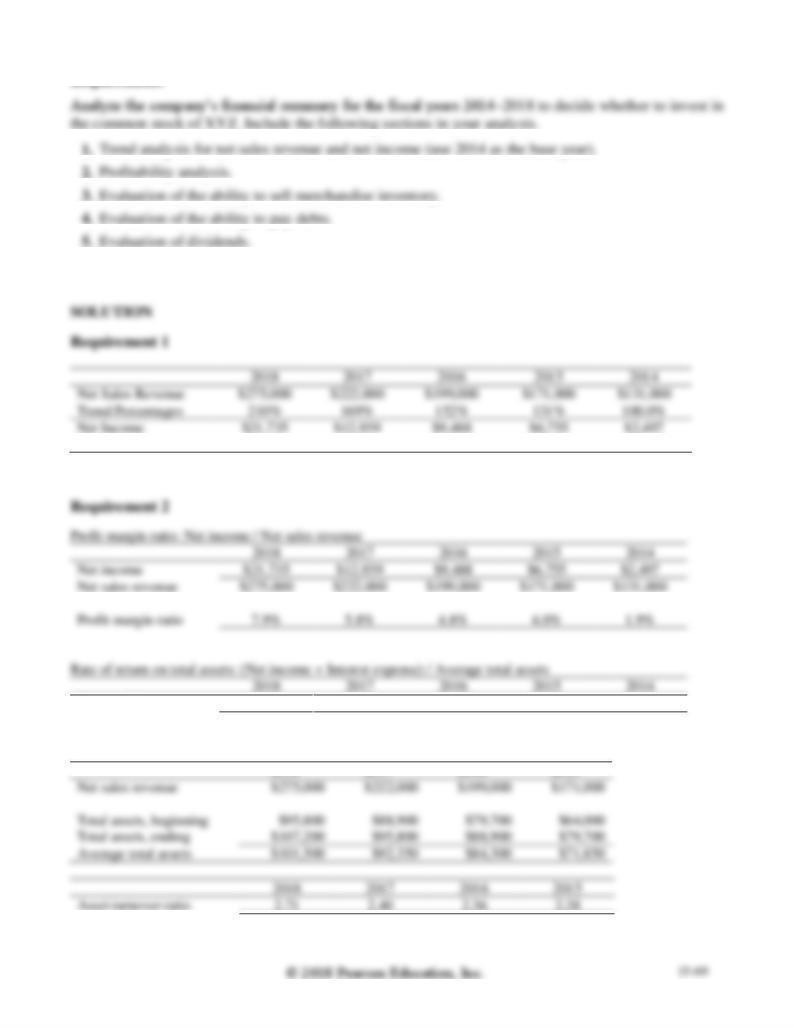
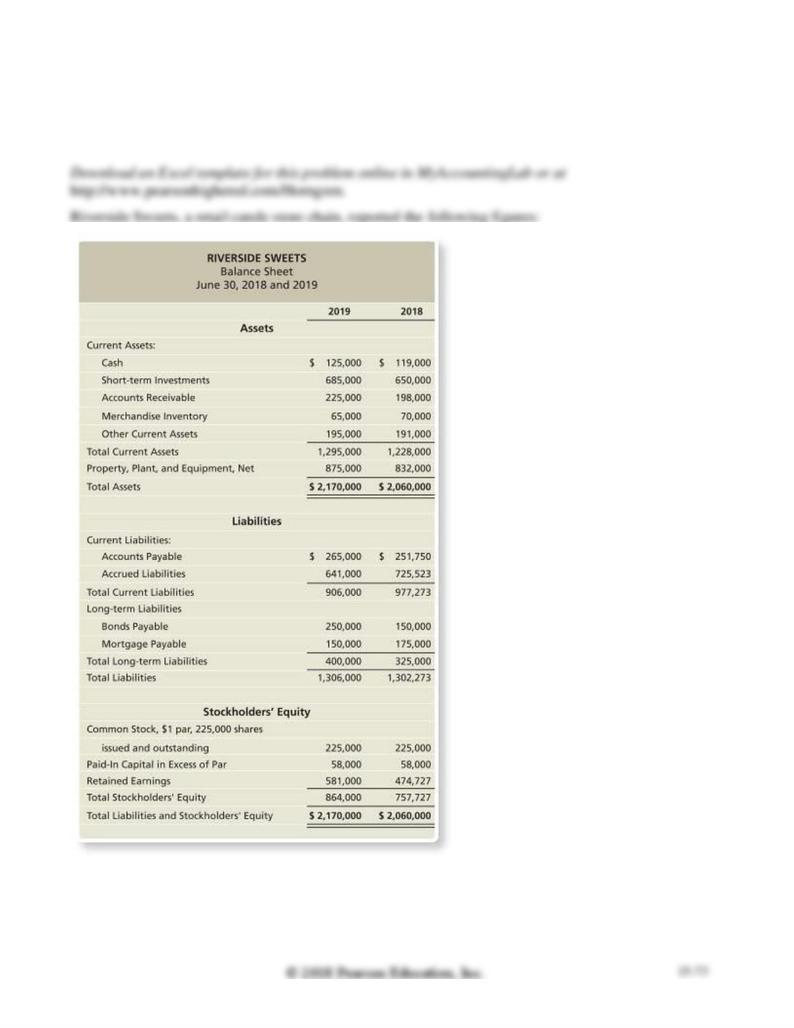
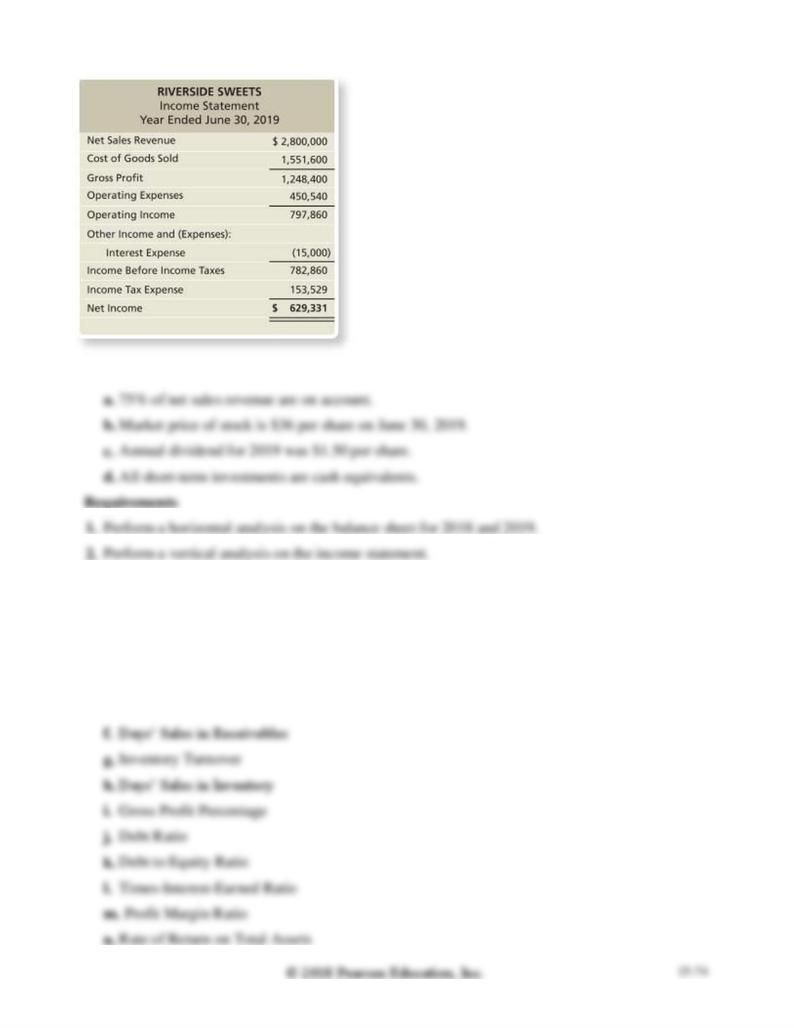
Requirements
6. Should you invest in the common stock of XYZ Athletic Supply, Inc.? Fully explain your final
decision
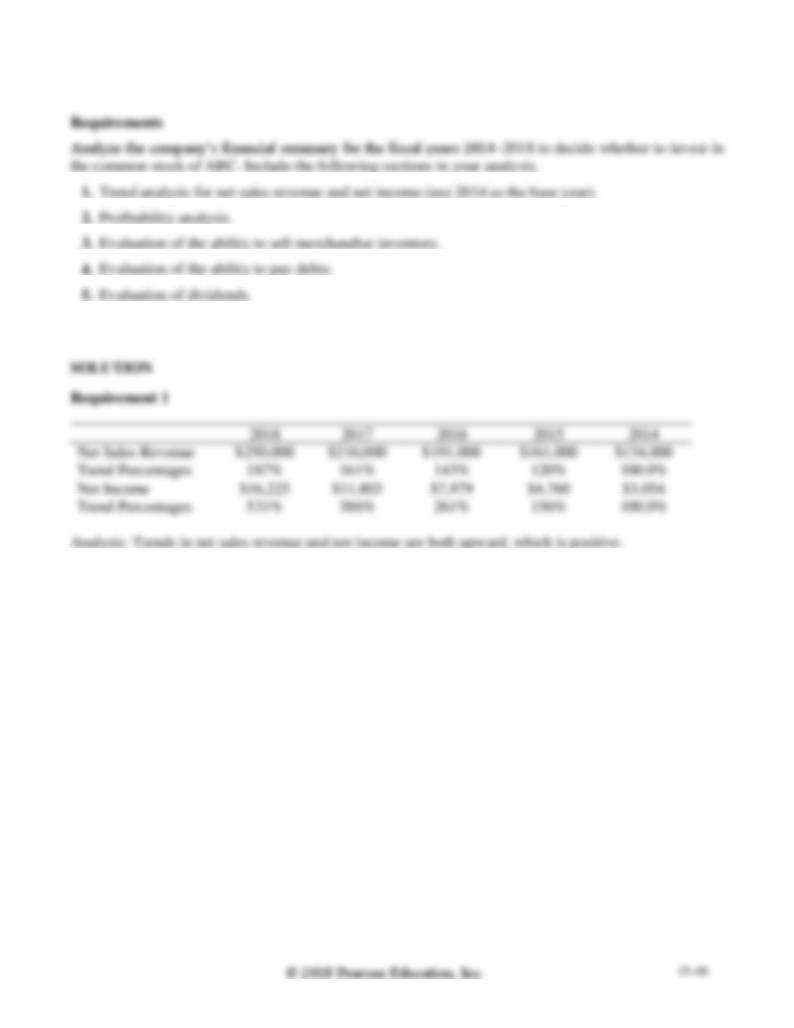
Trend Percentages
870%
518%
380%
271%
100.0%
Analysis: Trends in net sales revenue and net income are both upward, which is positive.
Given in data
22.5%
15.5%
12.8%
10.9%
9.9%
Asset turnover ratio: Net sales revenue / Average total assets
Given in data
44.2%
28.7%
24.1%
19.4%
18.9%
Given in data
$1.10
$0.80
$0.70
$0.50
$0.28
Analysis: The profit margin ratio, return on assets, asset turnover ratio, and return on equity are
increasing over the five years examined. The return on assets and the return on equity are both very
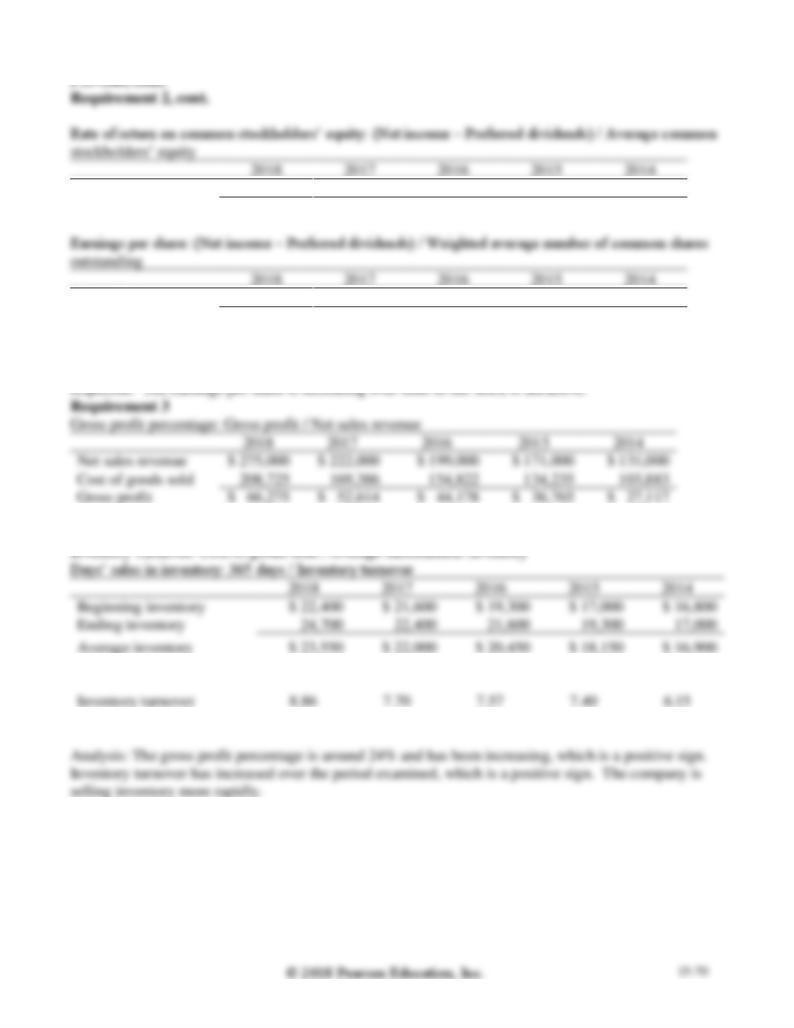
Gross profit %
24.1%
23.7%
22.2%
21.5%
20.7%
Days’ sales in inventory
41.2 days
47.4 days
48.2 days
49.3 days
59.3 days
Given in data
0.9
1.0
0.9
1.0
1.3
Current ratio: Current assets / Current liabilities
Current ratio
1.71
1.78
1.68
1.71
2.28
Debt ratio
51.9%
51.1%
51.3%
55.5%
46.7%

P15-36B, cont.
Requirement 4, cont.
Times interest earned ratio: (Net income + income tax expense + Interest expense) / Interest expense
ratio
25.44
13.29
10.85
10.22
7.53
Analysis: The current and quick ratios are fairly high. This indicates that the company can pay its
data)
$1.10
$0.80
$0.70
$0.50
$0.28
Dividend payout
41%
54%
56%
70%
111%
Analysis: The dividends per share and earnings per share ratios are both increasing over time. These are
Excel Skill Problem
P15-37 Using Excel for financial statement analysis
Additional financial information:
3. Compute the following ratios:
a. Working Capital
b. Current Ratio
c. Acid-Test (Quick) Ratio
d. Cash Ratio
e. Accounts Receivable Turnover

o. Asset Turnover Ratio
p. Rate of Return on Common Stockholders’ Equity
q. Earnings per Share (EPS)
r. Price/Earnings Ratio
s. Dividend Yield
t. Dividend Payout
Continuing Problem
P15-38 Using ratios to evaluate a stock investment
This problem continues the Canyon Canoe Company situation from Chapter 14. The company wants to
invest some of its excess cash in trading securities and is considering two investments, The Paddle
Company (PC) and Recreational Life Vests (RLV). The income statement, balance sheet, and other data
for both companies follow for 2019 and 2018, as well as selected data for 2017:
THE PADDLE COMPANY
RECREATIONAL LIFE VESTS
Comparative Financial Statements
Comparative Financial
Statements
Years Ended December 31
Years Ended December 31
Income Statement
2019
2018
2017
2019
2018
2017
Net Sales Revenue
$ 430,489
$ 425,410
$ 410,570
$ 383,870
Cost of Goods Sold
258,756
256,797
299,110
280,190
Gross Profit
171,733
168,613
111,460
103,680
Operating Expenses
153,880
151,922
78,290
70,830
Operating Income
17,853
16,691
33,170
32,850
Interest Expense
865
788
2,780
2,980
Income before Income Tax
16,988
15,903
30,390
29,870
Total Liabilities and
$ 299,204
$ 288,626
$ 315,250
$ 313,050
Annual dividend per share
0.32
0.30
0.53
0.45
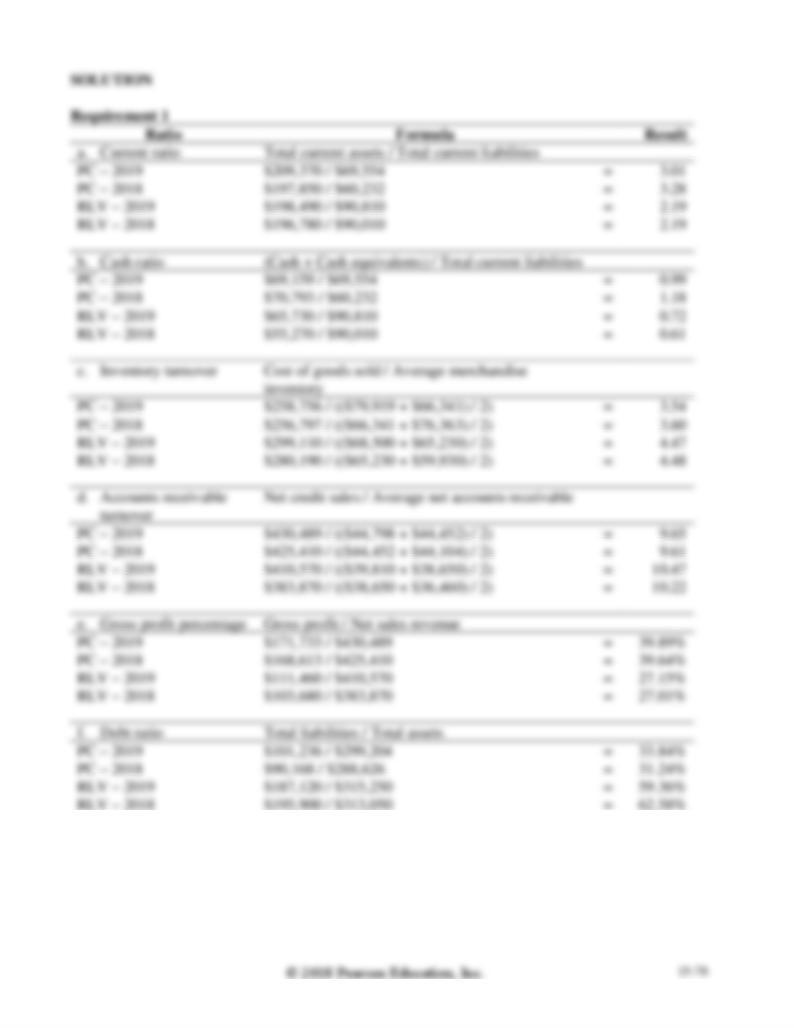
2018. Assume all sales are credit sales. Round all ratios to two decimal places.
a. Current ratio
b. Cash ratio
c. Inventory turnover
d. Accounts receivable turnover
e. Gross profit percentage
2. Compare the companies’ performance for 2019 and 2018. Make a recommendation to Canyon Canoe
Company about investing in these companies. Which company would be a better investment, The
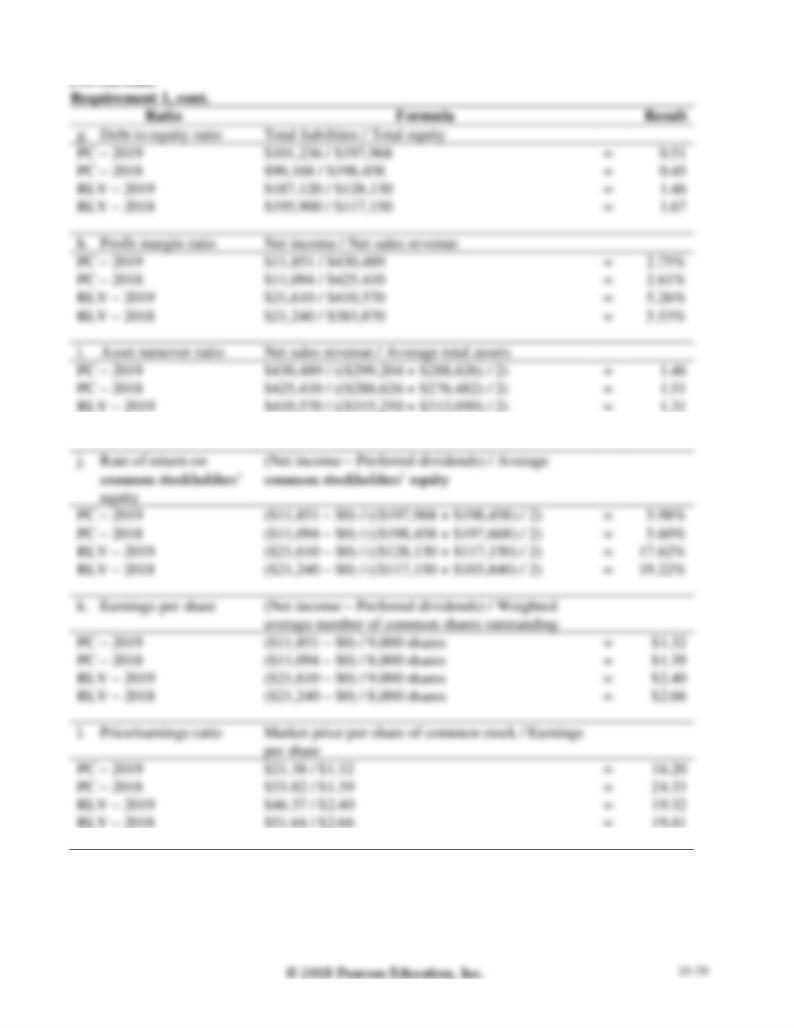
RLV – 2018
$383,870 / (($313,050 + $310,640) / 2)
=
1.23
RLV – 2018
$0.45 / $2.66
=
16.92%
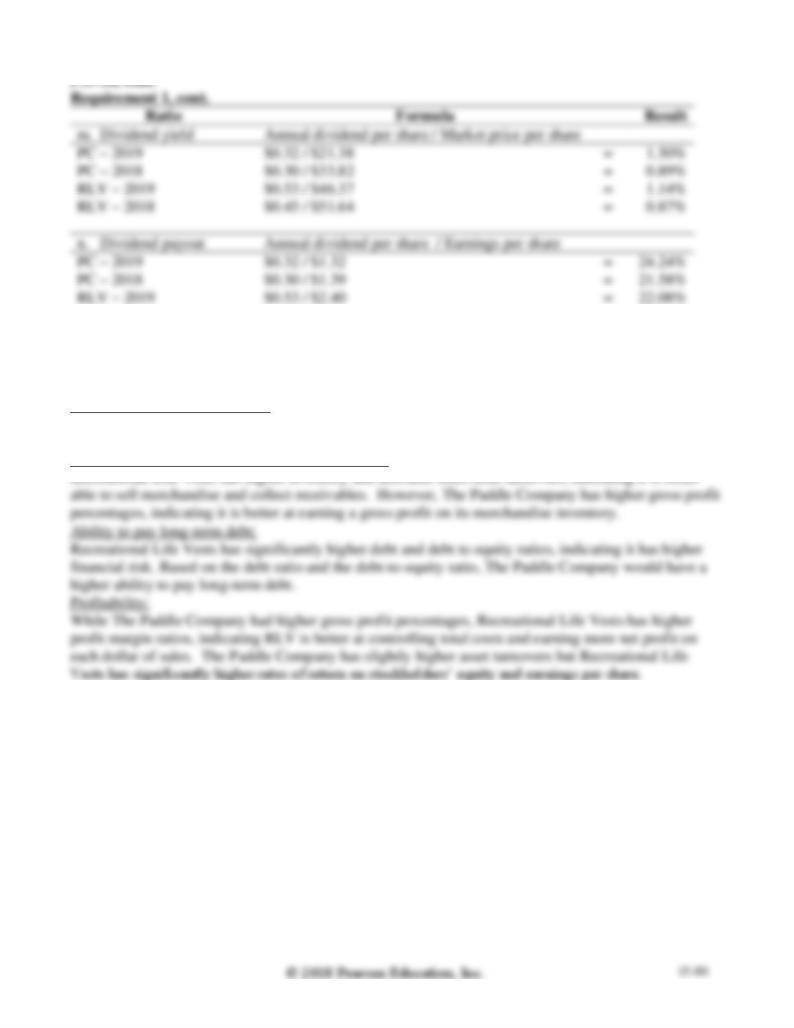
Requirement 2
Analysis:
Ability to pay current liabilities:
The Paddle Company has higher current ratios and cash ratios, indicating it is better able to pay current
liabilities.
Ability to sell merchandise and collect receivables:
P15-38, cont.
Requirement 2, cont.
Attractiveness as an investment:
Recreational Life Vests has a stable PE ratio, while The Paddle Company had a significant decrease in
Critical Thinking
Decision Case 15-1
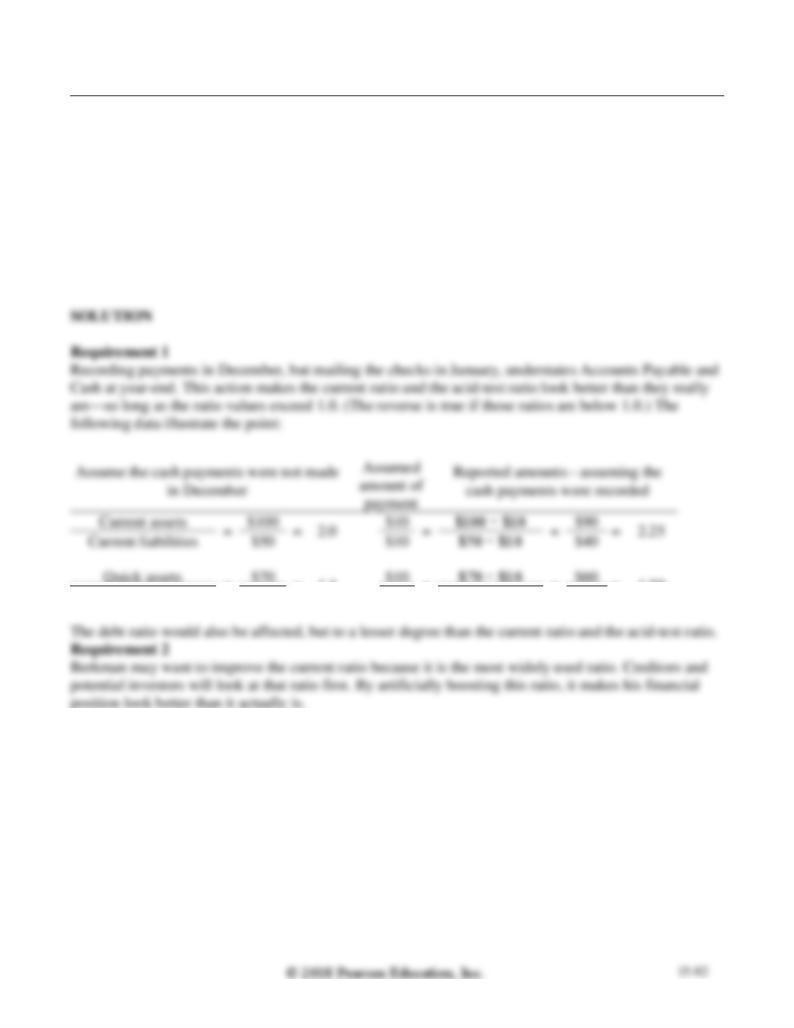
Lance Berkman is the controller of Saturn, a dance club whose year-end is December 31. Berkman
prepares checks for suppliers in December, makes the proper journal entries, and posts them to the
appropriate accounts in that month. However, he holds on to the checks and mails them to the suppliers
in January.
Requirements
1. What financial ratio(s) is(are) most affected by the action to hold onto the checks until January?
2. What is Berkman’s purpose in undertaking this activity?
=
=
1.4
=
=
=
1.50
Current liabilities
$50
$10
$50 − $10
$40
Ethical Issue 15-1
Ross’s Lipstick Company’s long-term debt agreements make certain demands on the business. For
example, Ross may not purchase treasury stock in excess of the balance of retained earnings. Also, long-
term debt may not exceed stockholders’ equity, and the current ratio may not fall below 1.50. If Ross
2. Shortly after the financial statements are released, sales improve; so, too, does the current ratio. As a
result, Ross’s management decides not to sell the investments it had reclassified as short-term.
Accordingly, the company reclassifies the investments as long-term. Has management behaved
unethically? Give the reasoning underlying your answer.
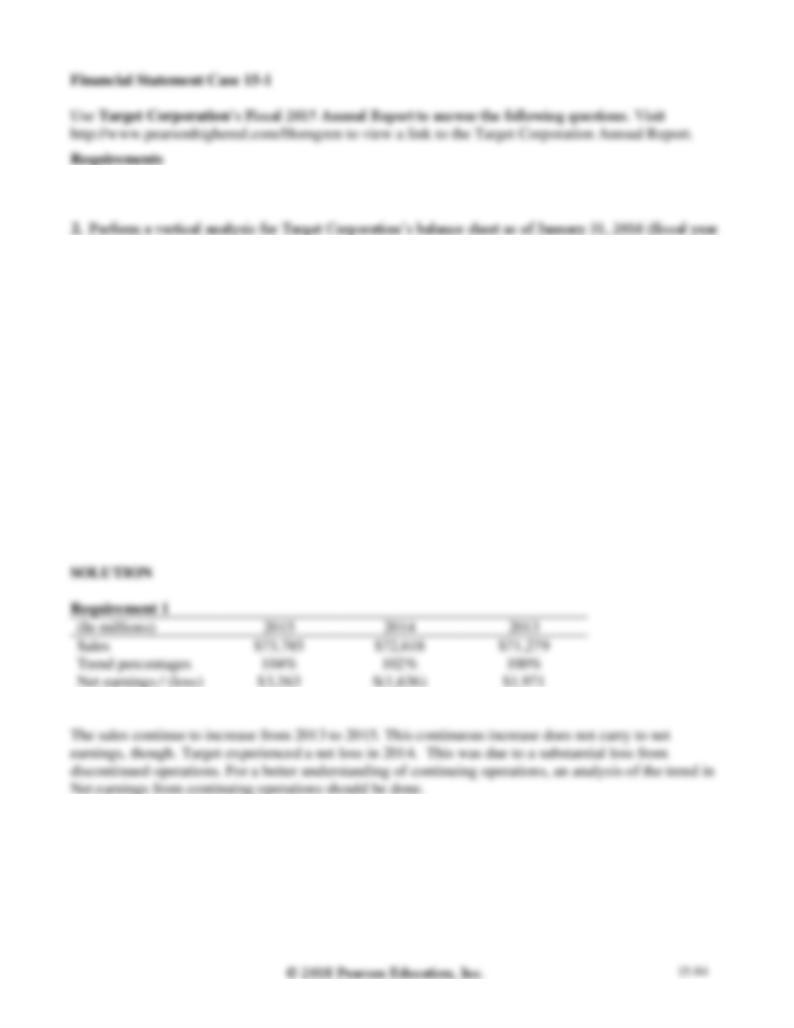
1. Compute trend analyses for Sales and Net earnings / (loss). Use 2013 as the base year. What is the
most notable aspect of these data?
2015), and January 31, 2015 (fiscal year 2014). Include only these main categories:
Assets:
Total current assets
Property and equipment, net
Noncurrent assets of discontinued operations
Other noncurrent assets
Total assets
Liabilities and shareholders’ investment:
Total current liabilities
Total noncurrent liabilities
Total shareholders’ investment
Total liabilities and shareholders’ investment
Trend percentages
171%
(83)%
100%
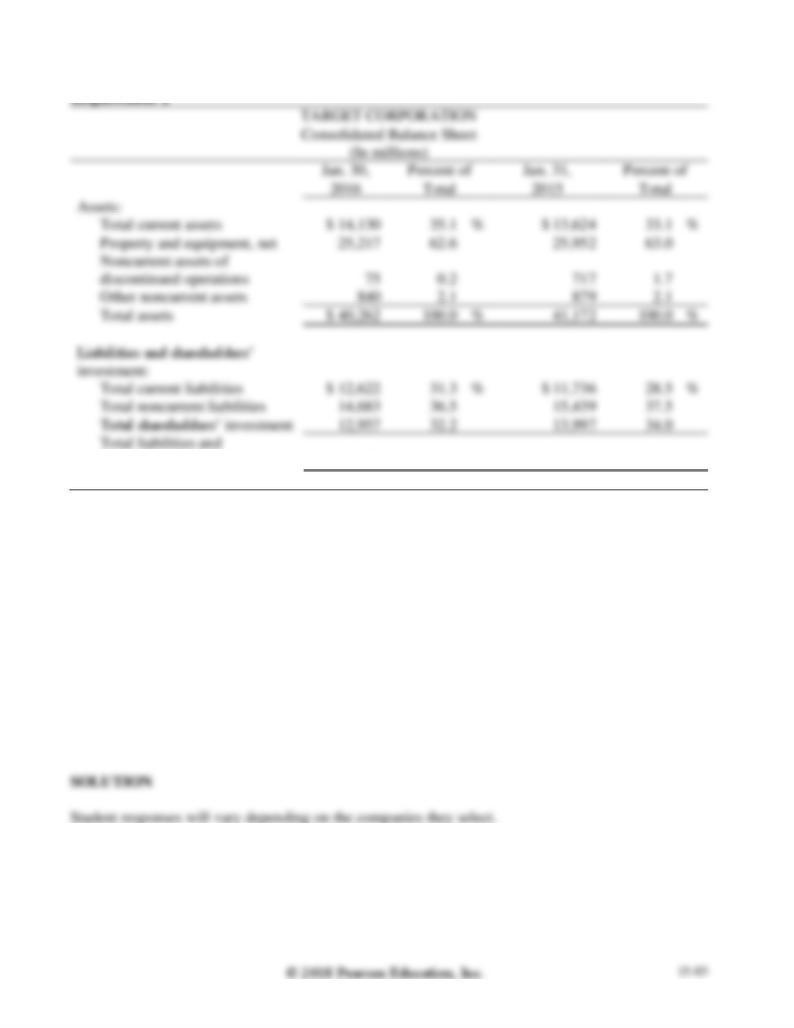
Financial Statement Case 15-1, cont.
shareholders’ investment
$ 40,262
100.0
%
$ 41,172
100.0
%
Team Project 15-1 and 15-2
Team Project 15-1
Select an industry you are interested in, and pick any company in that industry to use as the benchmark.
Then select two other companies in the same industry. For each category of ratios, compute all the ratios
for the three companies. Write a two-page report that compares the two companies with the benchmark
company.
Team Project 15-2
Select a company and obtain its financial statements. Convert the income statement and the balance
sheet to common size, and compare the company you selected to the industry average. The Risk
Management Association’s Annual Statement Studies and Dun & Bradstreet’s Industry Norms & Key
Business Ratios publish common-size statements for most industries.