Chapter 03: Financial Analysis
Chapter 3
Financial Analysis
Discussion Questions
3-1.
If we divide users of ratios into short-term lenders, long-term lenders, and
stockholders, in which ratios would each group be most interested, and for what
reasons?
3-2.
Explain how the Du Pont system of analysis breaks down return on assets. Also
explain how it breaks down return on stockholders’ equity.
The Du Pont system of analysis breaks out the return on assets between the
profit margin and asset turnover.
Return on assets = Profit margin × Asset turnover
assets Total
Sales
Sales
incomeNet
assets Total
incomeNet =
In this fashion, we can assess the joint impact of profitability and asset turnover
Chapter 03: Financial Analysis
3-3.
If the accounts receivable turnover ratio is decreasing, what will be happening
to the average collection period?
Chapter 03: Financial Analysis
3-4.
What advantage does the fixed charge coverage ratio offer over simply using
times interest earned?
3-5.
Is there any validity in rule-of-thumb ratios for all corporations (for example, a
current ratio of 2 to 1 or debt to assets of 50 percent)?
3-6.
Why is trend analysis helpful in analyzing ratios?
Chapter 03: Financial Analysis
3-7.
Inflation can have significant effects on income statements and balance sheets,
and therefore on the calculation of ratios. Discuss the possible impact of
inflation on the following ratios, and explain the direction of the impact based
on your assumptions.
a. Return on investment.
b. Inventory turnover.
c. Fixed asset turnover.
d. Debt-to-assets ratio.
a.
assets Total
incomeNet
investmenton Return =
Inflation may cause net income to be overstated and total assets to be
understated causing an artificially high ratio that is misleading.
Sales
Chapter 03: Financial Analysis
3-9.
Why might disinflation prove to be favorable to financial assets?
3-10.
Comparisons of income can be very difficult for two companies even though
they sell the same products in equal volume. Why?
Chapter 3
Problems
1. Profitability ratios (LO2) Low Carb Diet Supplement Inc. has two divisions. Division A
has a profit of $156,000 on sales of $2,010,000. Division B is able to make only $28,800
on sales of $329,000. Based on the profit margins (returns on sales), which division is
superior?
Chapter 03: Financial Analysis
Low Carb Diet Supplements
Division A Division B
Sales 2,010,000 $329,000
Division B is superior.
2. Profitability ratios (LO2) Database Systems is considering expansion into a new product
line. Assets to support expansion will cost $380,000. It is estimated that Database can
generate $1,410,000 in annual sales, with an 8 percent profit margin. What would net
income and return on assets (investment) be for the year?
Database Systems
Net income = Sales profit margin
= $1,410,000 0.08
= $112,800
Return on assets Net income
(investment) Total assets
$112,800
$380,000
=
=
Chapter 03: Financial Analysis
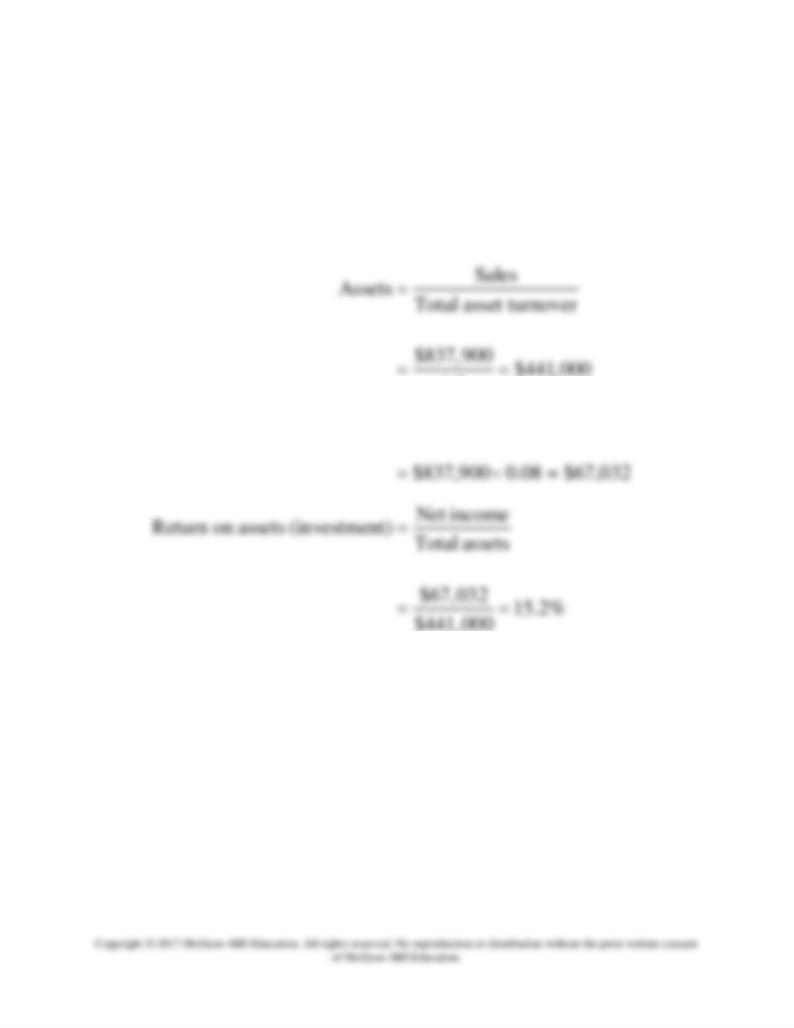
3. Profitability ratios (LO2) Polly Esther Dress Shops Inc. can open a new store that will do
an annual sales volume of $837,900. It will turn over its assets 1.9 times per year. The
profit margin on sales will be 8 percent. What would net income and return on assets
(investment) be for the year?
3-3. Solution:
Polly Esther Dress Shops Inc.
1.9
Net income Sales Profit Margin
=
4. Profitability ratios (LO2) Billy’s Crystal Stores Inc. has assets of $5,960,000 and turns
over its assets 1.9 times per year. Return on assets is 8 percent. What is the firm’s profit
margin (return on sales)?
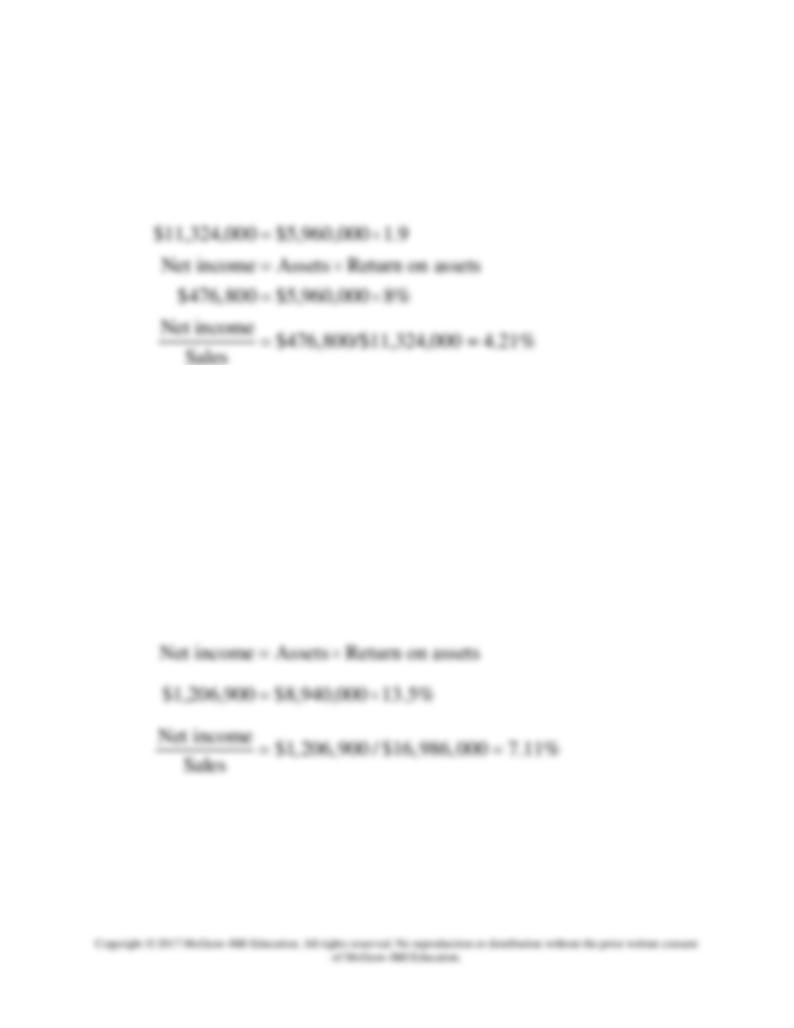
Chapter 03: Financial Analysis
3-4. Solution:
Billy’s Crystal Stores Inc.
Sales Assets total asset turnover
=
5. Profitability ratios (LO2) Elizabeth Tailors Inc. has assets of $8,940,000 and turns over
its assets 1.9 times per year. Return on assets is 13.5 percent. What is the firm’s profit
margin (returns on sales)?
3-5. Solution:
Elizabeth Tailors Inc.
Sales Assets Total asset turnover
$16,986,000 $8,940,000 1.9
=
=
Chapter 03: Financial Analysis
6. Profitability ratios (LO2) Dr. Zhivàgo Diagnostics Corp. income statements for 20X1 are
as follows:
Sales .......................................................................................$2,790,000
Cost of goods sold .................................................................. 1,790,000
Gross profit ............................................................................ 1,000,000
Selling and administrative expense ........................................ 302,000
Operating profit ...................................................................... 698,000
Interest expense ...................................................................... 54,800
Income before taxes ............................................................... 643,200
Taxes (30%) ........................................................................... 192,960
Income after taxes .................................................................. $ 450,240
a. Compute the profit margin for 20X1.
b. Assume that in 20X2, sales increase by 10 percent and cost of goods sold increases by
20 percent. The firm is able to keep all other expenses the same. Assume a tax rate of
30 percent on income before taxes. What is income after taxes and the profit margin for
20X2?
Dr. Zhivàgo Diagnostics
a. Profit margin for 20X1
Net income $450,240 16.14%
Sales $2,790,000
==
b. Sales .............................................................. $3,069,000*
Cost of goods sold ........................................ 2,148,000**
Gross profit ................................................... 921,000
Selling and administrative expense .............. 302,000
Operating profit ............................................ 619,000
Interest expense ............................................ 54,800
Income before taxes ..................................... 564,200
Taxes (30%) ................................................. 169,260
Income after taxes (20X2) ............................ $ 394,940
Chapter 03: Financial Analysis
3-6. (Continued)
* $2,790,000 × 1.10 = $3,069,000
7. Profitability ratios (LO2) The Haines Corp. shows the following financial data for 20X1
and 20X2.
20X1
20X2
Sales
$ 3,230,000
$3,370,000
Cost of goods sold
2,130,000
2,850,000
Gross profit
1,100,000
520,000
Chapter 03: Financial Analysis
Haines Corp.
20X1 20X2
Sales 3,230,000 3,370,000
It is decreasing profitability.
Sales 3,230,000 3,370,000
==
It is increasing profitability.
Sales 3,230,000 3,370,000
It is not changing profitability.
8. Profitability ratios (LO2) Easter Egg and Poultry Company has $2,000,000 in assets and
$1,400,000 of debt. It reports net income of $200,000.
Easter Egg and Poultry Company
a.
Net income
Return on assets (investment) Total assets
$200,000 10%
$2,000,000
=
=
Chapter 03: Financial Analysis
b.
Net income
Return on equity Stockholders' equity
Stockholders' equity Total assets Total debt
$2,000,000 $1,400,000
$600,000
=
=−
=−
=
−
3-8. (Continued)
c.
Sales Total assets Total assets turnover
=
9. Profitability ratios (LO2) Network Communications has total assets of $1,500,000 and
current assets of $612,000. It turns over its fixed assets three times a year. It has $319,000
of debt. Its return on sales is 8 percent. What is its return on stockholders’ equity?
3-9. Solution:
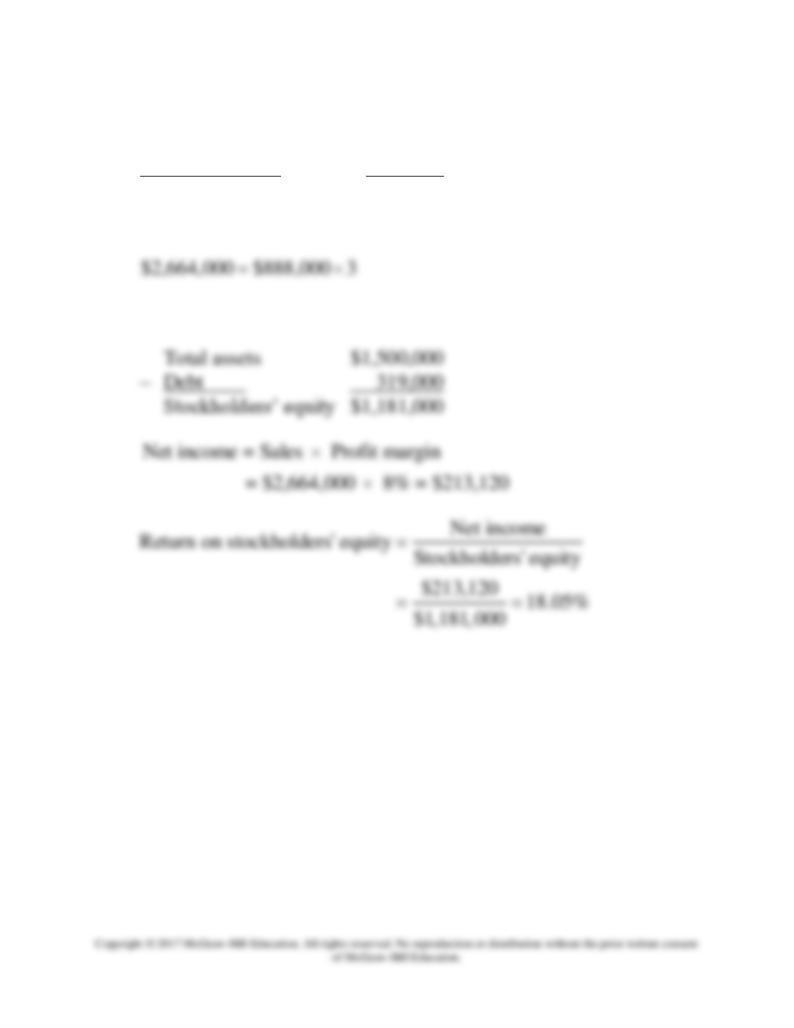
Chapter 03: Financial Analysis
Network Communications
Total assets $1,500,000
– Current assets 612,000
Fixed assets $ 888,000
Sales Fixed assets Fixed asset turnover
=
Chapter 03: Financial Analysis
10. Profitability ratios (LO2) Fondren Machine Tools has total assets of $3,310,000 and
current assets of $879,000. It turns over its fixed assets 3.6 times per year. Its return on
sales is 4.8 percent. It has $1,750,000 of debt. What is its return on stockholders’ equity?
Fondren Machine Tools
Total assets $3,310,000
– Current assets 879,000
Fixed assets $2,431,000
Sales Fixed assets Fixed asset turnover
$8,751,600 $2,431,000 3.6
=
=
Net income = Sales Profit margin
$8,751,600 4.8% = $420,076.80
Total assets $3,310,000
– Debt 1,750,000
Stockholders’ equity $1,560,000
Net income
Return on stockholders' equity Stockholders' equity
$420,076.80 26.93%
$1,560,000
=
==
11. Profitability ratios (LO2) Baker Oats had an asset turnover of 1.6 times per year.
a. If the return on total assets (investment) was 11.2 percent, what was Baker’s profit
1.4 times and its profit margin was 8 percent. How did the return on total assets
change from that of the previous year?

Chapter 03: Financial Analysis
1.6 × ? = 11.2%
12. Du Pont system of analysis (LO3) AllState Trucking Co. has the following ratios
compared to its industry for last year.
3-12. Solution:
AllState Trucking Company
Chapter 03: Financial Analysis
Return on assets=Asset turnover
Return on sales
15% 10%
vs
3% 8%
AllState’s turnover 5x versus 1.25x Industry turnover
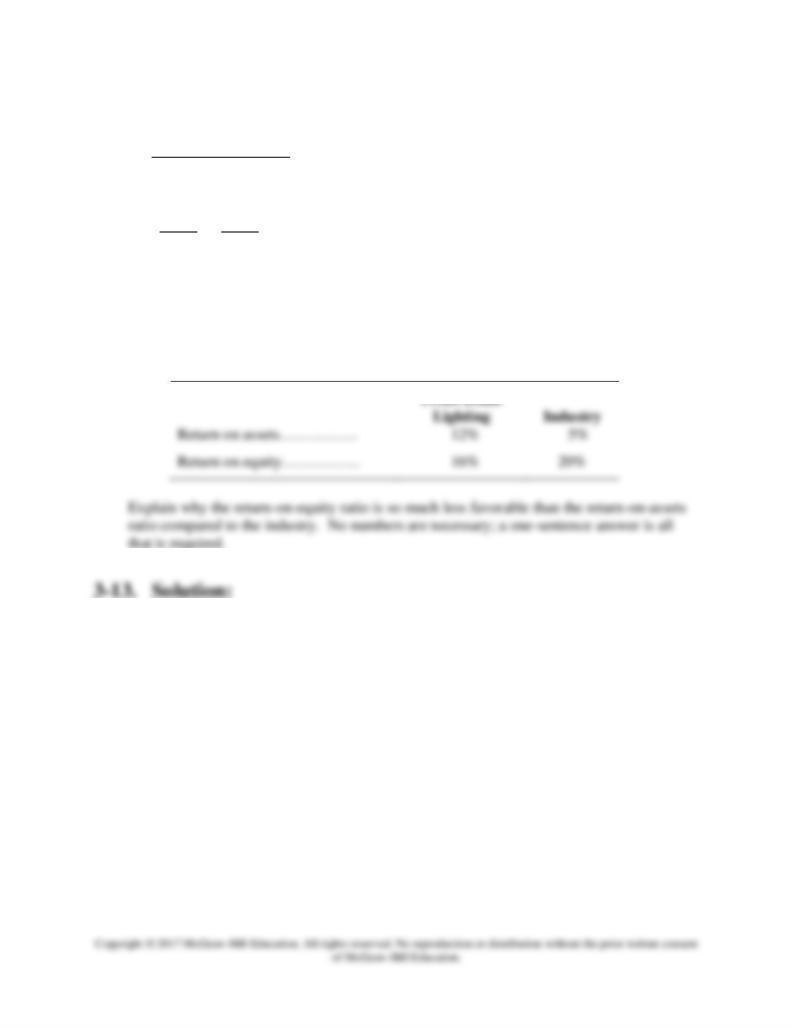
13. Du Pont system of analysis (LO3) Front Beam Lighting Company has the following
ratios compared to its industry for last year.
Front Beam Lighting Company
Front Beam has a lower debt-to-total-assets ratio than the
industry.
For those who did a calculation, Front Beam’s debt-to-assets was
75 percent versus 25 percent for the industry.
Chapter 03: Financial Analysis
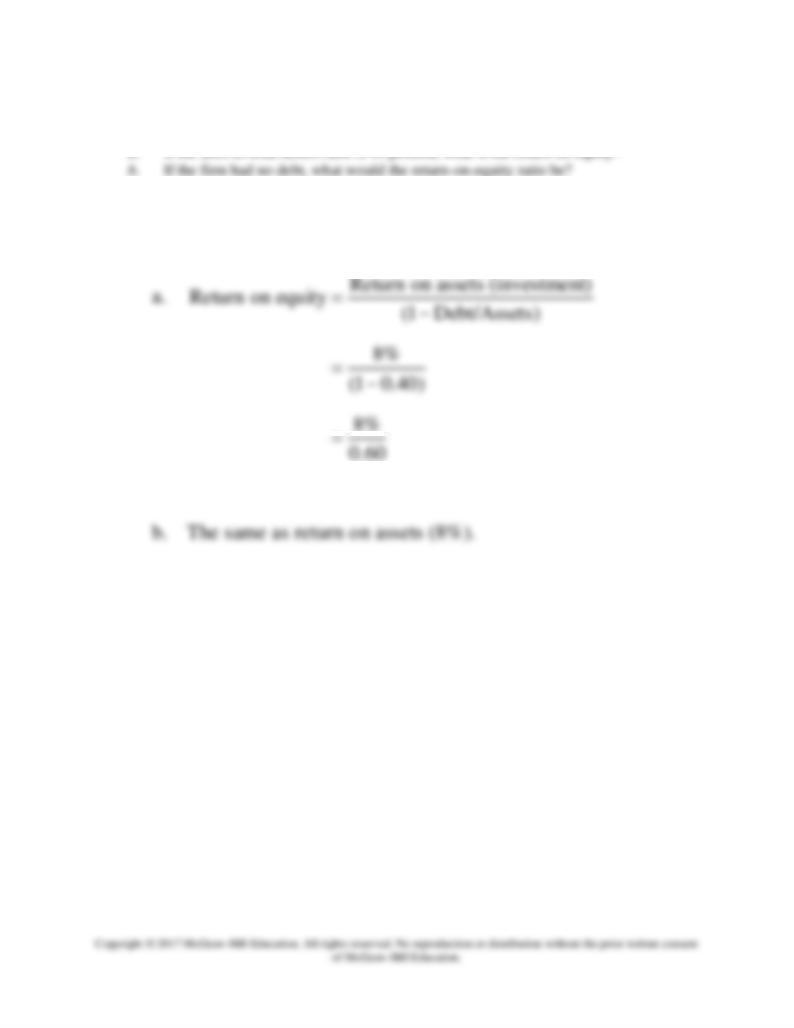
14. Du Pont system of analysis (LO3) Gates Appliances has a return-on-assets (investment)
ratio of 8 percent.
3-14. Solution:
Gates Appliances
13.33%
=
Chapter 03: Financial Analysis
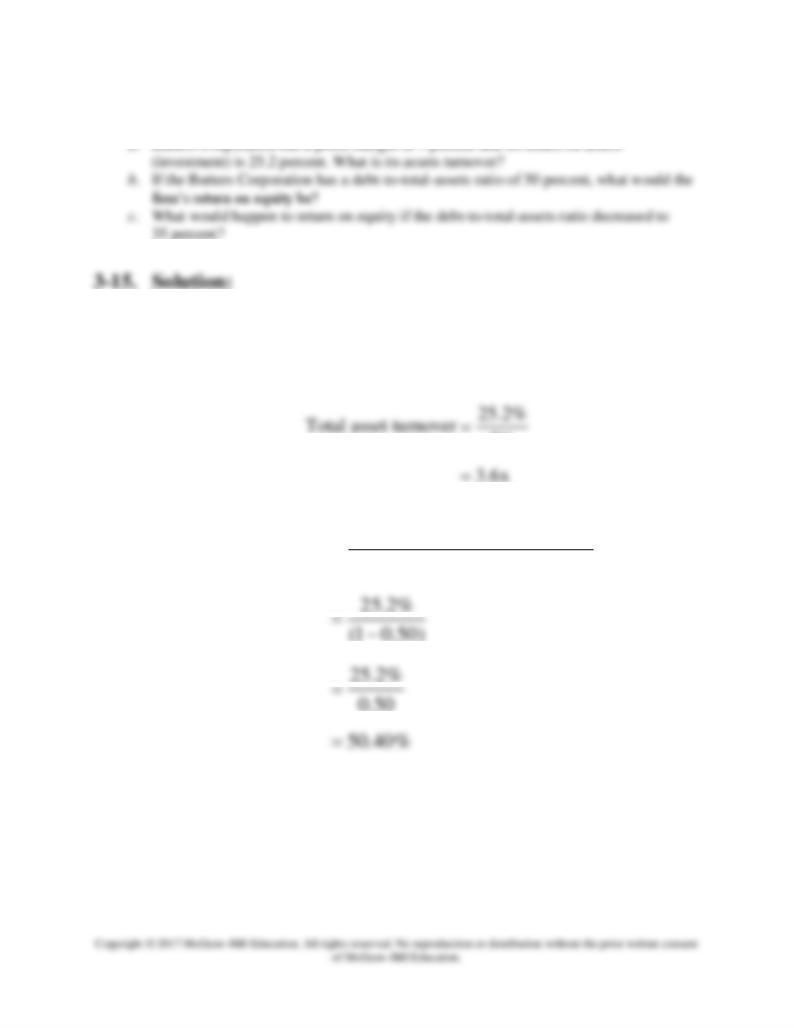
15. Du Pont system of analysis (LO3) Using the Du Pont method, evaluate the effects of the
following relationships for the Butters Corporation:
Butters Corporation
a.
Profit margin Total asset turnover Return on asset (investment)
7% ? 25.2%
=
=
=
b.
Return on assets (investment)
Return on equity (1 Debt/Assets)
=−
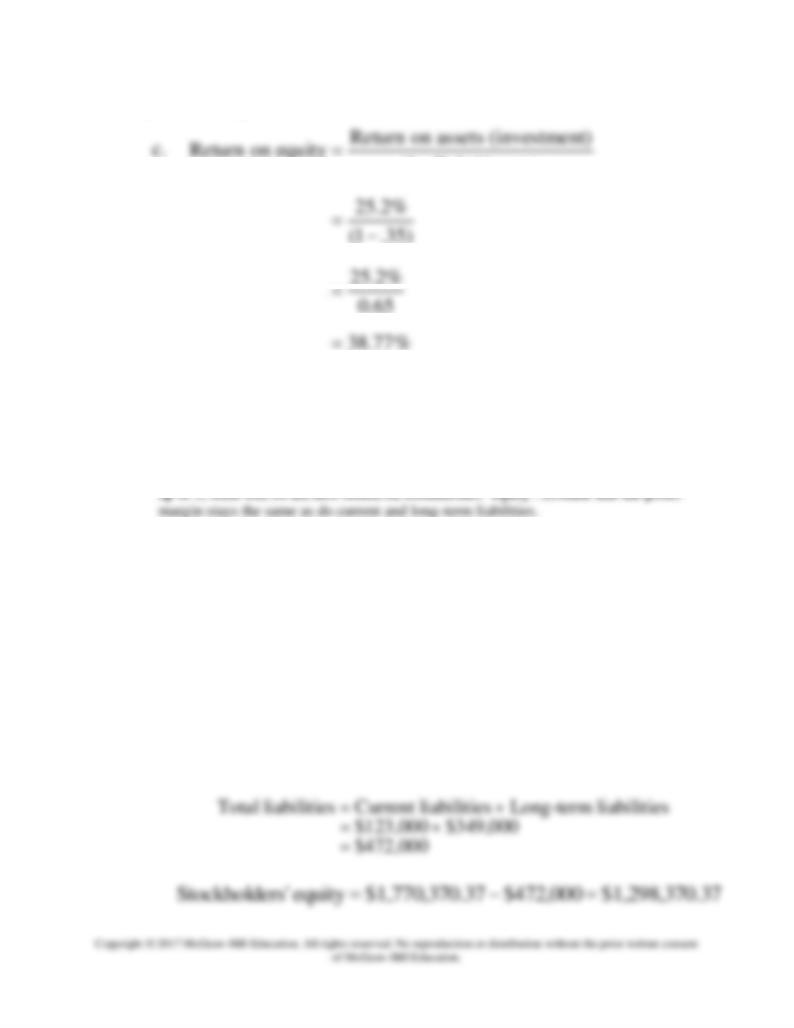
Chapter 03: Financial Analysis
3-15. (Continued)
16. Du Pont system of analysis (LO3) Jerry Rice and Grain Stores has $4,780,000 in yearly
sales. The firm earns 4.5 percent on each dollar of sales and turns over its assets 2.7 times
per year. It has $123,000 in current liabilities and $349,000 in long-term liabilities.
a. What is its return on stockholders’ equity?
b. If the asset base remains the same as computed in part a, but total asset turnover goes
3-16. Solution:
Jerry Rice and Grain Stores
a.
Net income Sales profit margin
$4,780,000 4.5%
$215,100
Stockholders' equity Total assets Total liabilities
Total assets Sales/Total asset turnover
$4,780,000/2.7
$1,770,370.37
=
=
=
=−
=
=
=
Chapter 03: Financial Analysis
Chapter 03: Financial Analysis
b. The new level of sales will be:
Sales Total assets Total asset turnover
$1,770,370.37 3
$5,311,111.11
=
=
=
Net income Sales Profit margin
$5,31,111.11 4.5%
$239,000
=
=
=
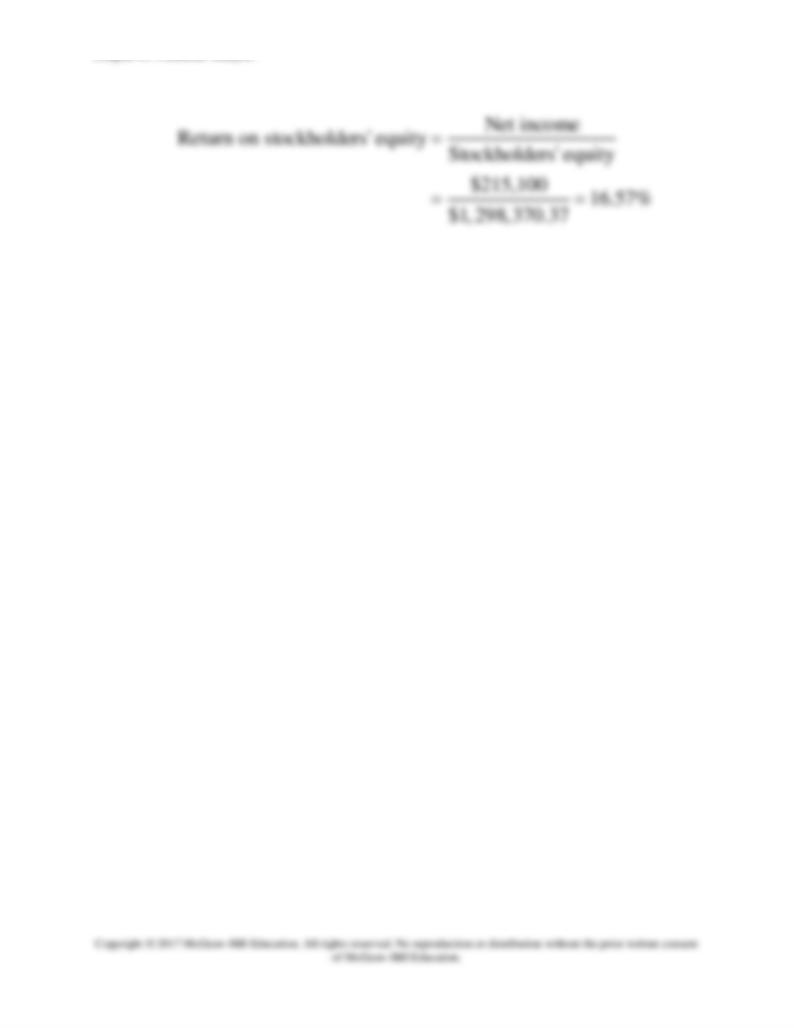
Net income
Return on stockholders' equity Stockholders' equity
$239,000 18.41%
$1,298,370.37
=
==
17. Interpreting results from the Du Pont system of analysis (LO3) Assume the following
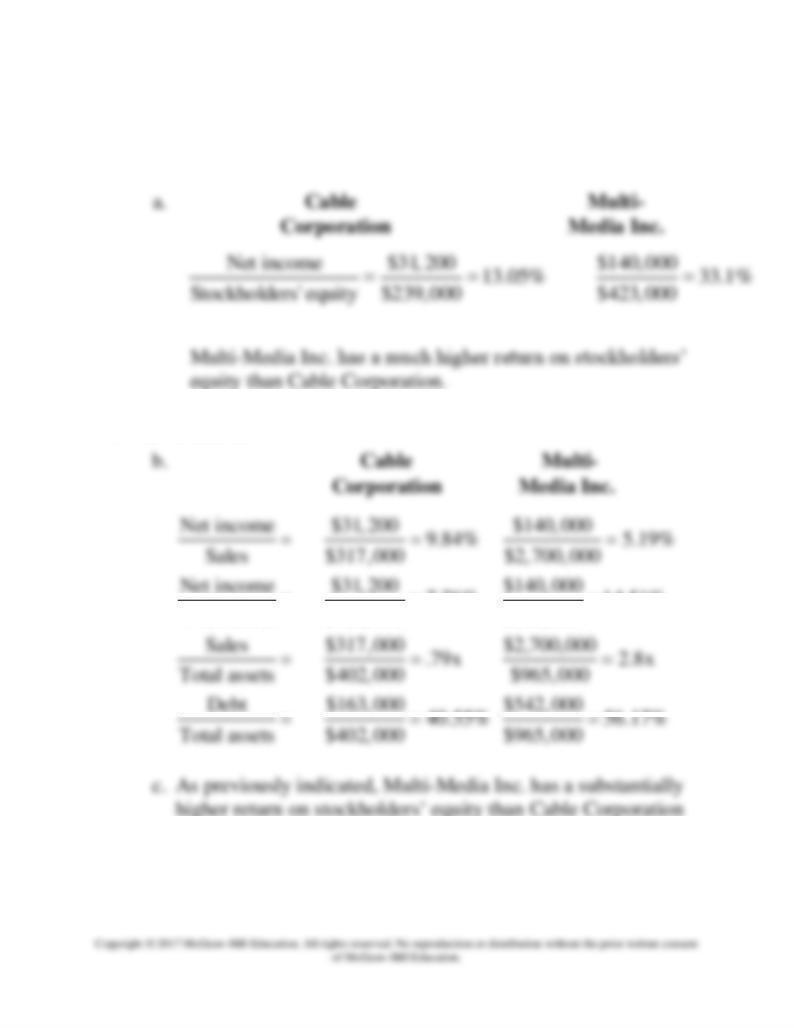
data for Cable Corporation and Multi-Media Inc.
Cable Multi-
Corporation Media Inc.
Net income ................................ $ 31,200 $ 140,000
Sales .......................................... 317,000 2,700,000
Total assets ................................ 402,000 965,000
Total debt .................................. 163,000 542,000
Stockholders’ equity ................. 239,000 423,000
Chapter 03: Financial Analysis
3-17. Solution:
Cable Corporation and Multi-Media Inc.
3-17. (Continued)
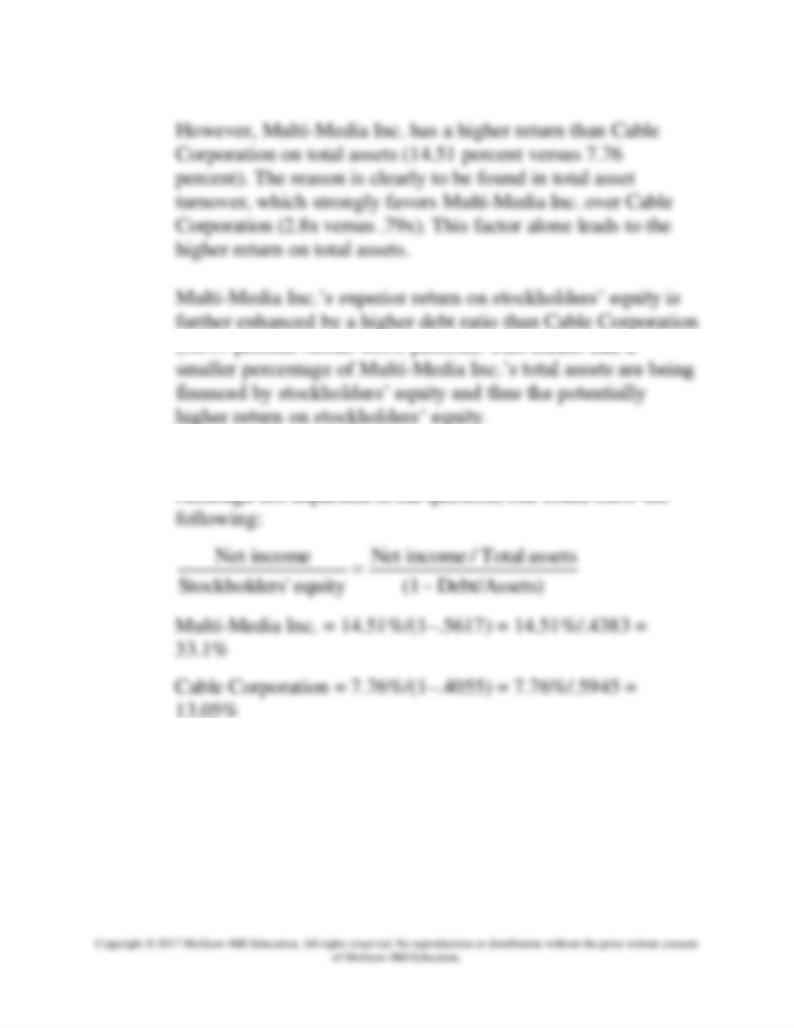
7.76% 14.51%
Total assets $402,000 $965,000
= = =
(33.1 percent versus 13.05 percent). The reason is certainly not
to be found on return on the sales dollar where Cable
Corporation has a higher return than Multi-Media Inc. (9.84
percent versus 5.19 percent).
Chapter 03: Financial Analysis
3-17. (Continued)
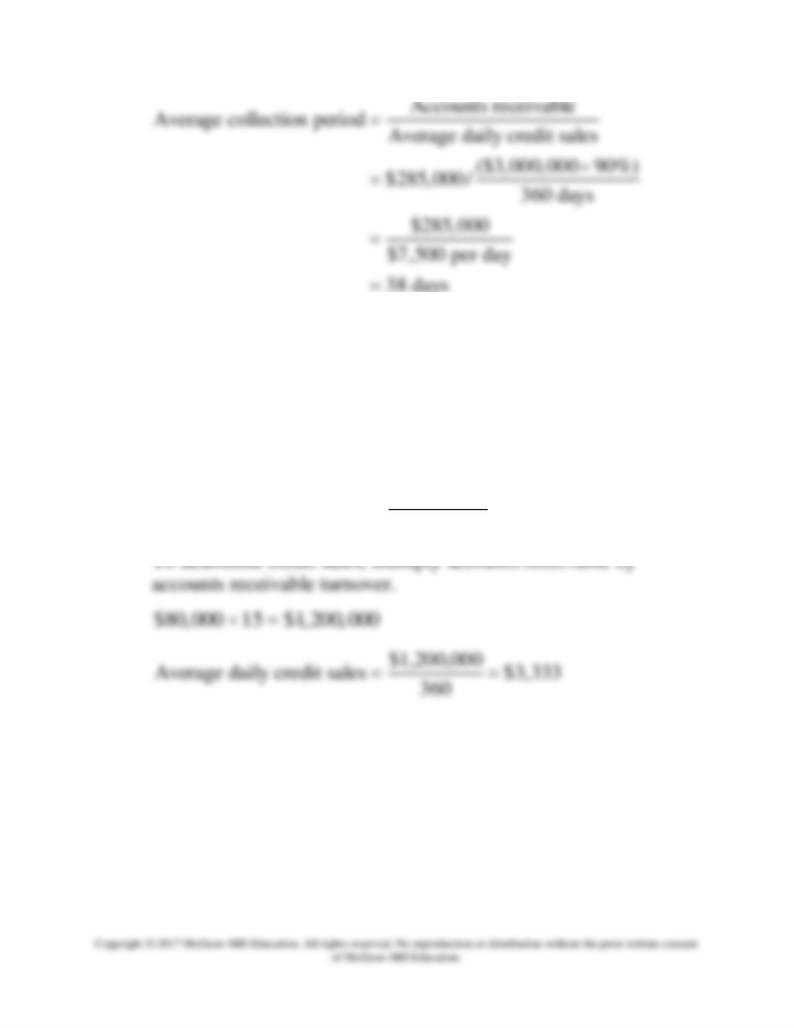
18. Average collection period (LO2) A firm has sales of $3 million, and 10 percent of the
sales are for cash. The year-end accounts receivable balance is $285,000. What is the
average collection period? (Use a 360-day year.)
3-18. Solution:
Chapter 03: Financial Analysis
19. Average daily sales (LO2) Martin Electronics has an accounts receivable turnover equal to
15 times. If accounts receivable are equal to $80,000, what is the value for average daily
credit sales?
3-19. Solution:
Martin Electronics
Credit sales
Average daily credit sales 360
=
Chapter 03: Financial Analysis
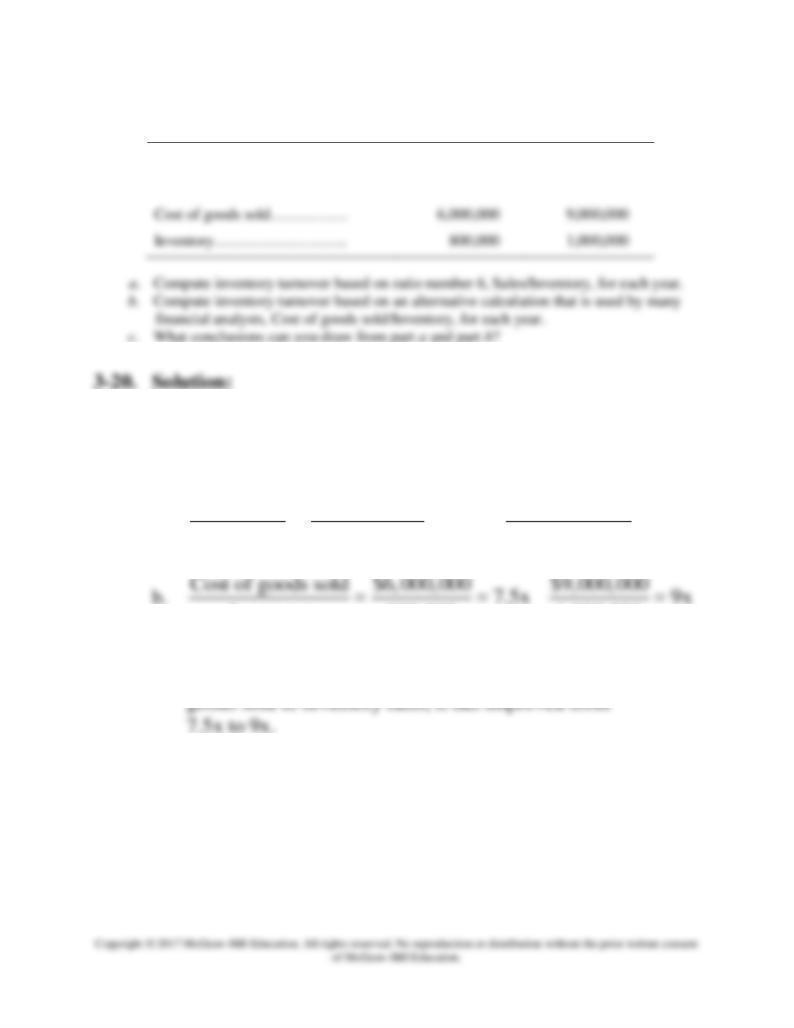
20. Inventory turnover (LO2) Perez Corporation has the following financial data for the
years 20X1 and 20X2:
20X1
20X2
Sales…………………………
$8,000,000
$10,000,000
Perez Corporation
20X1 20X2
a.
Sales $8,000,000 $10,000,000
10x 10x
Inventory 8,00,000 1,000,000
= = =
b.
Inventory 800,000 1,000,000
c. Based on the sales-to-inventory ratio, the turnover has
remained constant at 10x. However, based on the cost of
The latter ratio may be providing a false picture of
improvement in this example simply because cost of goods
sold has gone up as percentage of sales has (from 75 percent
to 90 percent). Inventory is not really turning over any faster.
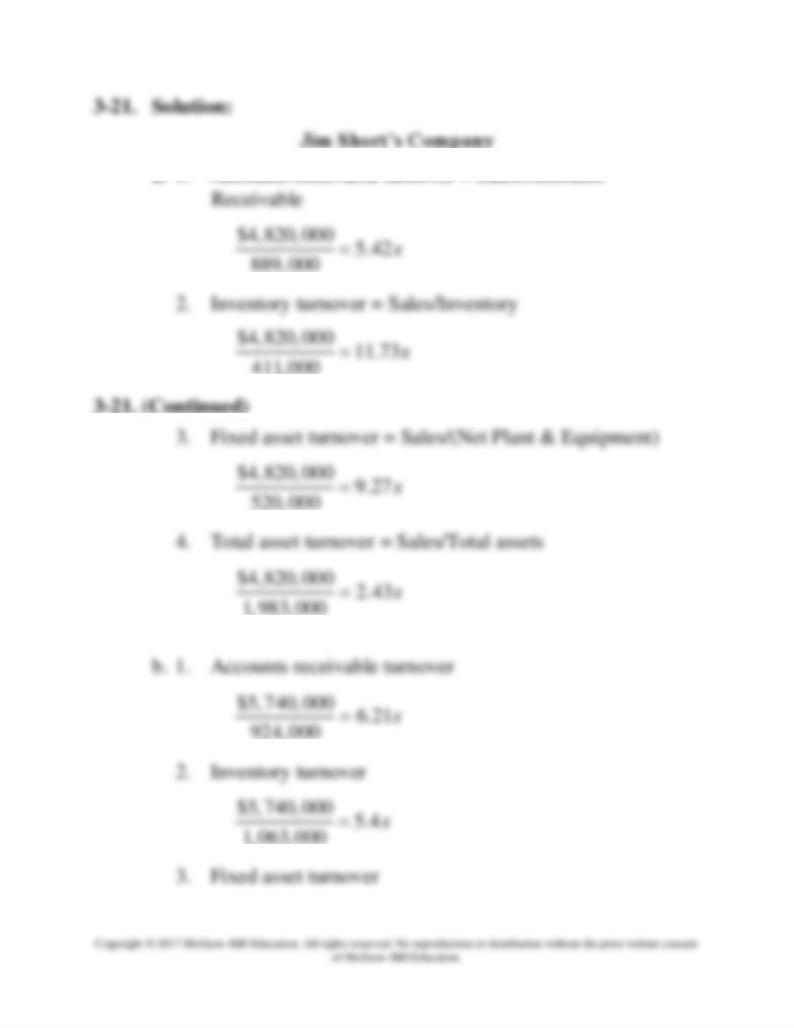
21. Turnover ratios (LO2) Jim Short’s Company makes clothing for schools. Sales in 20X1
were $4,820,000. Assets were as follows:
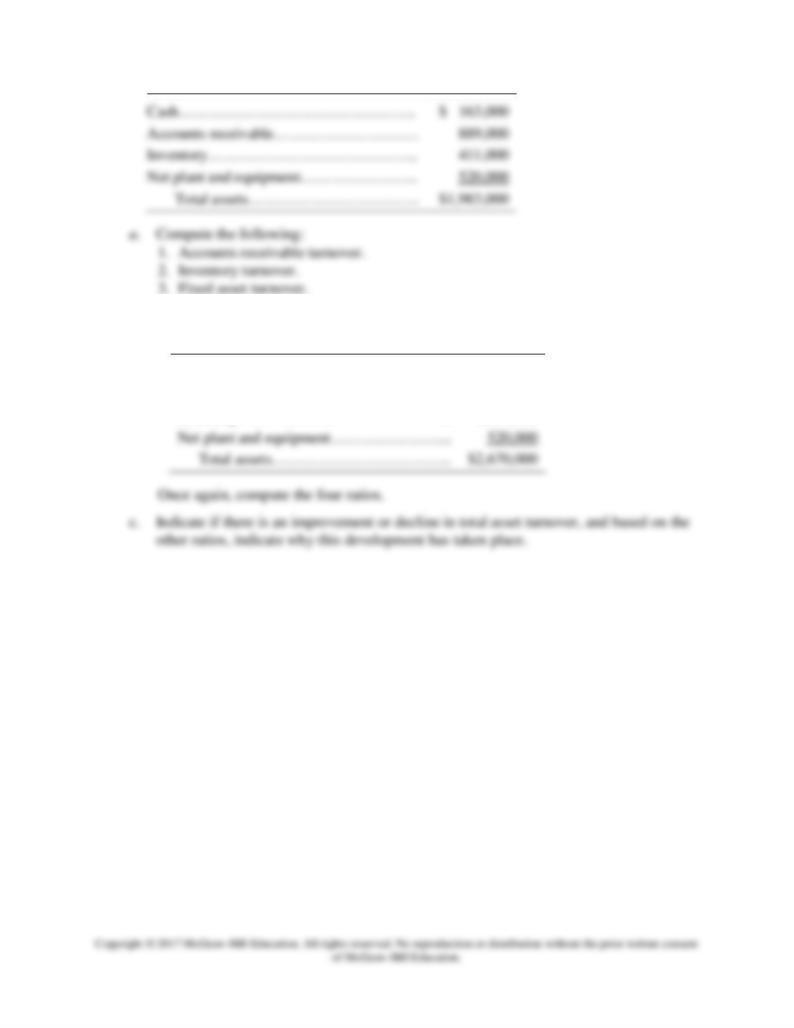
Chapter 03: Financial Analysis
4. Total asset turnover.
b. In 20X2, sales increased to $5,740,000 and the assets for that year were as follows:
Cash………………………………………...
$ 163,000
Accounts receivable………………………..
924,000
Inventory…………………………………...
1,063,000
Chapter 03: Financial Analysis
Chapter 03: Financial Analysis
$5,740,000 11.04
520,000 x=
$5,740,000 2.15
2,670,000 x=
c. There is a decline in total asset turnover from 2.43 to 2.15.
This development has taken place because of the slowdown in
inventory turnover (11.73 down to 5.4). The other two ratios
are slightly improved.
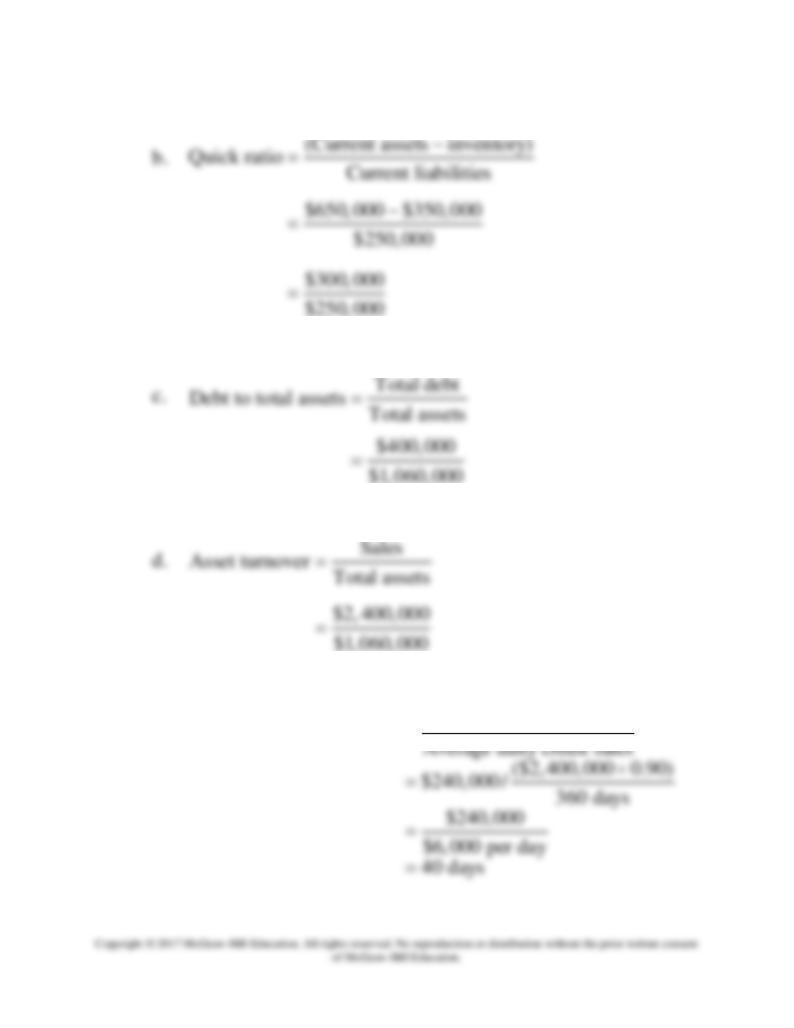
22. Overall ratio analysis (LO2) The balance sheet for Stud Clothiers is shown next. Sales for
the year were $2,400,000, with 90 percent of sales sold on credit.
STUD CLOTHIERS
Balance Sheet 20X1
Assets
Liabilities and Equity
Cash……………………
$ 60,000
Accounts payable……………..
$ 220,000
Accounts receivable…...
240,000
Accrued taxes…………………
30,000
Inventory………………
350,000
Bonds payable
150,000
3-22. Solution:
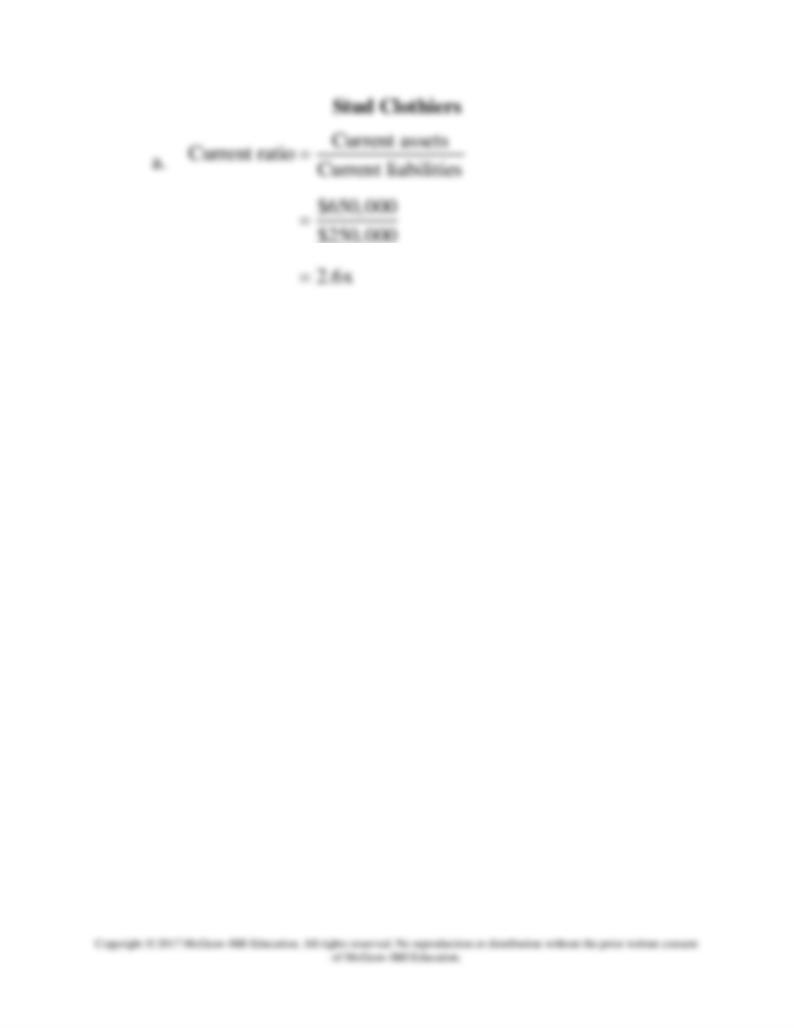
Chapter 03: Financial Analysis
Chapter 03: Financial Analysis
3-22. (Continued)
1.2x
=
37.74%
=
2.26x
=
e.
Accounts receivable
Average collection period Average daily credit sales
=
Chapter 03: Financial Analysis
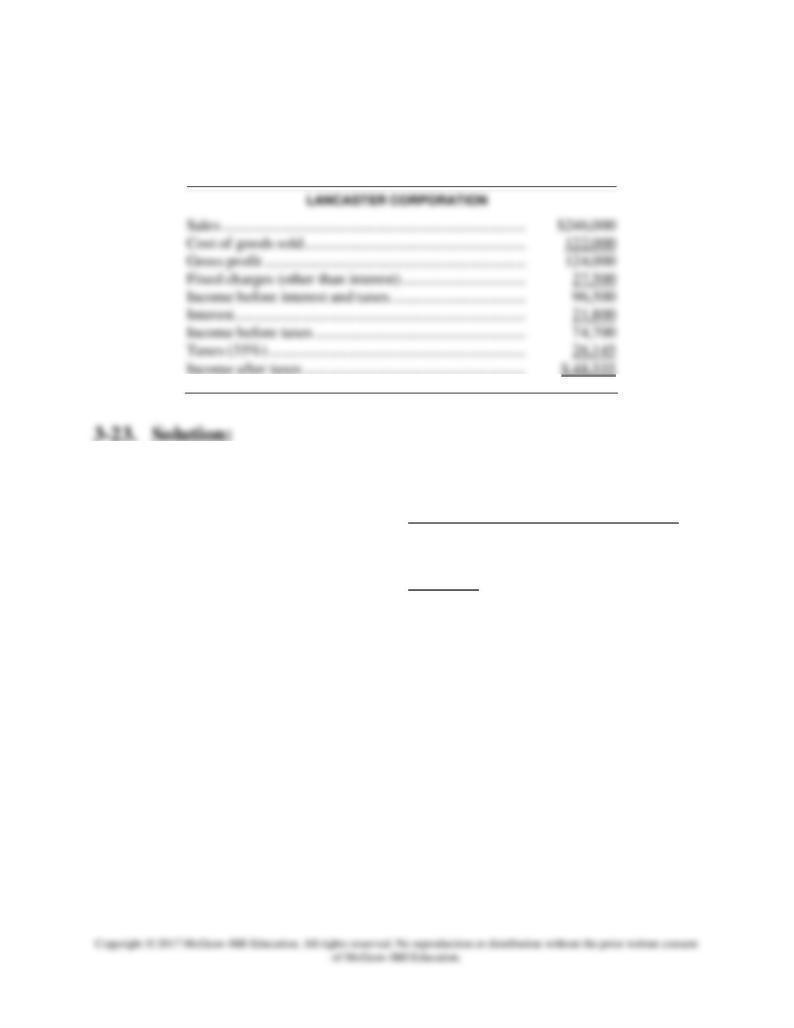
23. Debt utilization ratios (LO2) The Lancaster Corporation’s income statement is given
next.
a. What is the times-interest-earned ratio?
b. What would be the fixed-charge-coverage ratio?
Lancaster Corporation
a.
Income before interest and taxes
Times interested earned Interest
$96,500
21,800
4.43x
=
=
=
Chapter 03: Financial Analysis
b.
Fixed charge coverage Fixed charges
$96,500 27,500
$21,800 27,500
$124,000
$49,300
=
+
=+
=
24. Debt utilization and Du Pont system of analysis (LO3) Using the income statement for
Times Mirror and Glass Co., compute the following ratios:
a. The interest coverage.
b. The fixed charge coverage.
The total assets for this company equal $80,000. Set up the equation for the Du Pont
system of ratio analysis, and compute c, d, and e.
c. Profit margin.
d. Total asset turnover.
e. Return on assets (investment).
Times Mirror and Glass Co.
Chapter 03: Financial Analysis
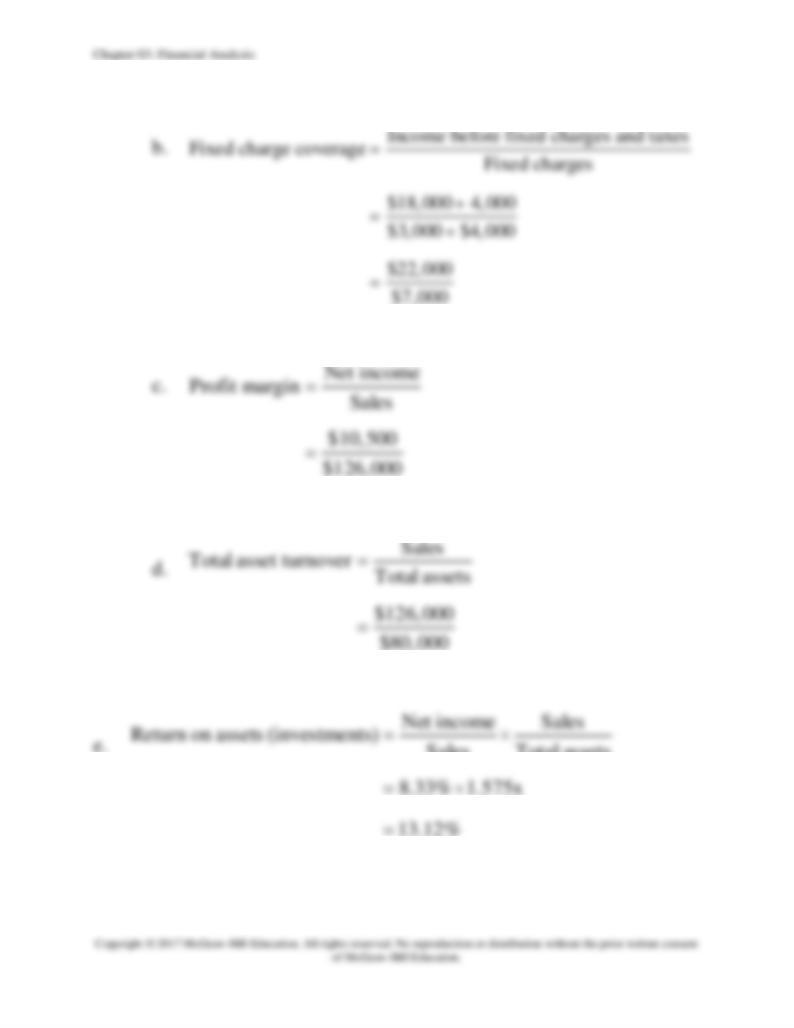
3-24. (Continued)
3.14x
=
8.33%
=
1.575x
=
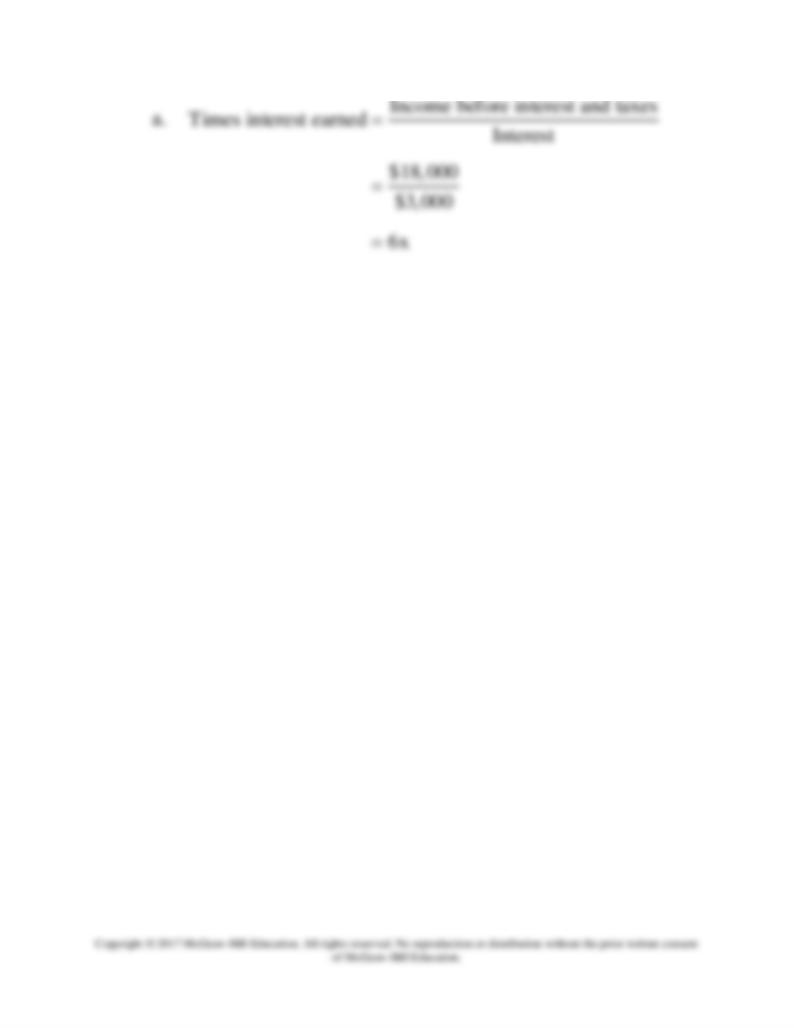
25. Debt utilization (LO2) A firm has net income before interest and taxes of $193,000 and
interest expense of $28,100.
a. What is the times-interest-earned ratio?
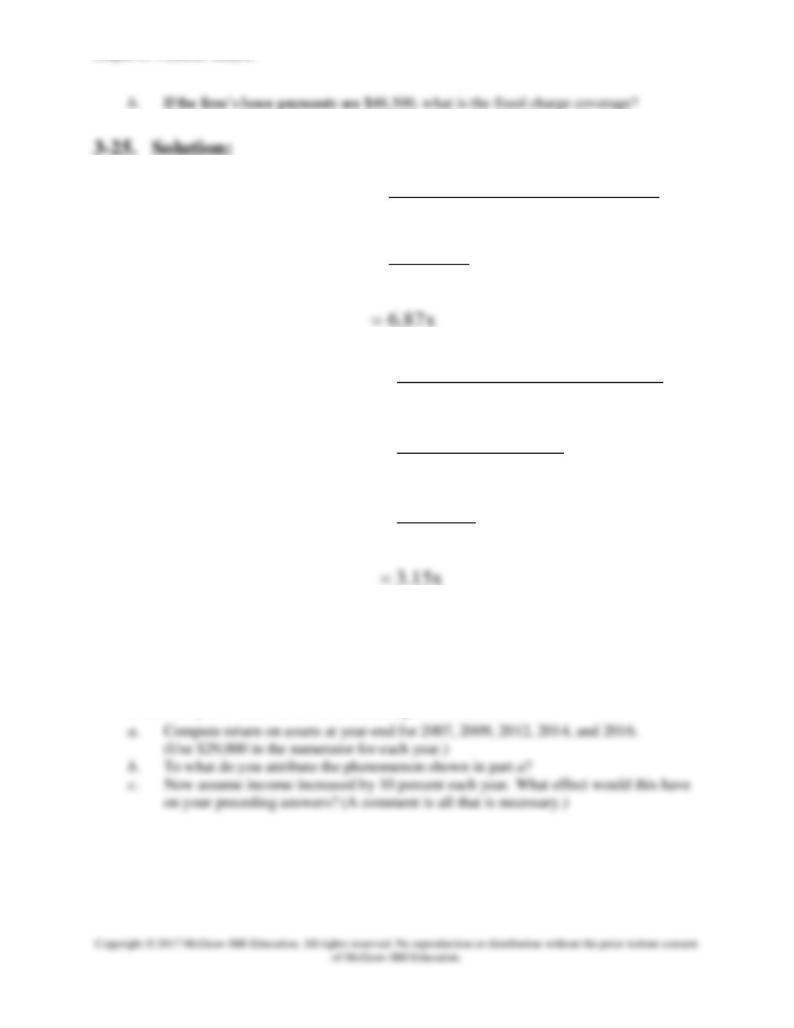
Chapter 03: Financial Analysis
a.
Income before interest and taxes
Times interest earned Interest
$193,000
$28,100
=
=
b.
IBIT + Before tax fixed charges
Fixed charge coverage Interest + Fixed charges
$193,000 $48,500
$28,100 $48,500
$241,500
$76,600
=
+
=+
=
26. Return on assets analysis (LO2) In January 2007, the Status Quo Company was formed.
Total assets were $544,000, of which $306,000 consisted of depreciable fixed assets. Status
Quo uses straight-line depreciation of $30,600 per year, and in 2007 it estimated its fixed
assets to have useful lives of 10 years. Aftertax income has been $29,000 per year each of
the last 10 years. Other assets have not changed since 2007.
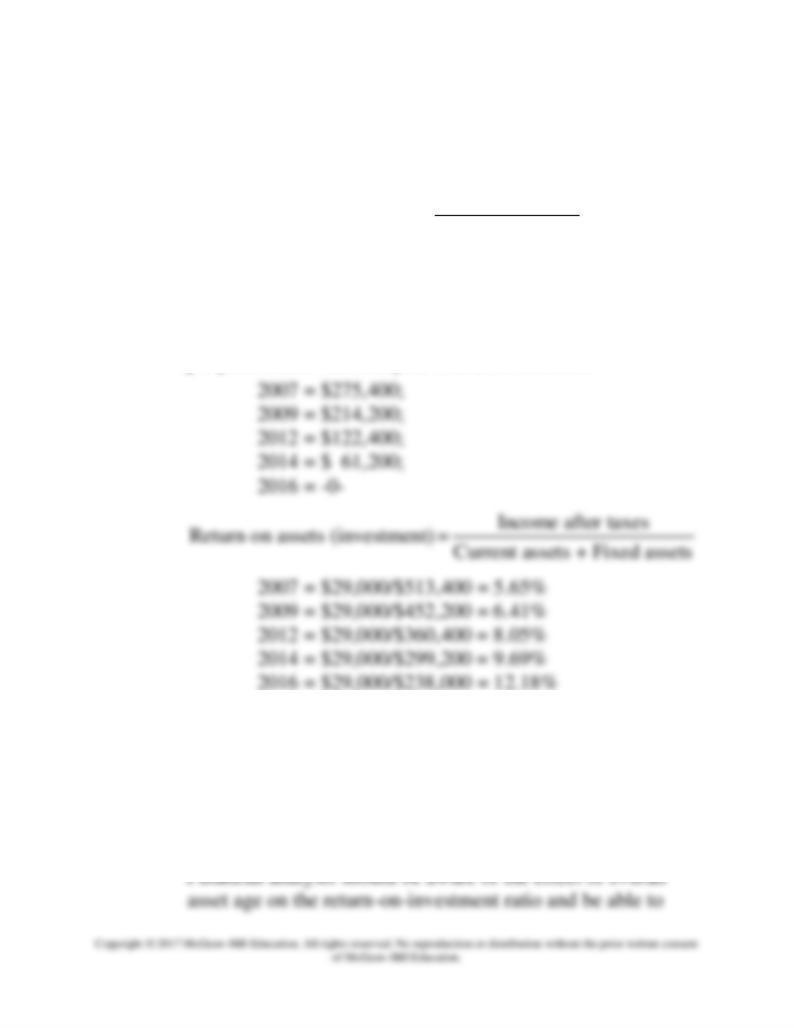
Chapter 03: Financial Analysis
3-26. Solution:
Status Quo Company
a.
Income after taxes
Return on assets (investment)= Total assets
The return on assets for Status Quo will increase over time as
the assets depreciate and the denominator gets smaller. Fixed
assets at the beginning of 2007 equal $306,000 with a 10-year
life, which means the depreciation expense will be $30,600
per year. Book values at year-end are as follows:
3-26. (Continued)
b. The increasing return on assets over time is due solely to the
fact that annual depreciation charges reduce the amount of
investment. The increasing return is in no way due to
operations.
Chapter 03: Financial Analysis
27. Trend analysis (LO4) Jolie Foster Care Homes Inc. shows the following data:
Year Net Income Total Assets Stockholders’ Equity Total Debt
3-27. Solution:
Jolie Foster Care Homes Inc.
a.
Net income
Total assets
20X1 $155,000/$2,390,000 = 6.49%
20X2 $191,000/$2,700,000 = 7.07
20X3 $208,000/$2,730,000 = 7.62
20X4 $192,000/$2,470,000 = 7.77
Comment: There is a strong upward movement in return on
assets over the four-year period.
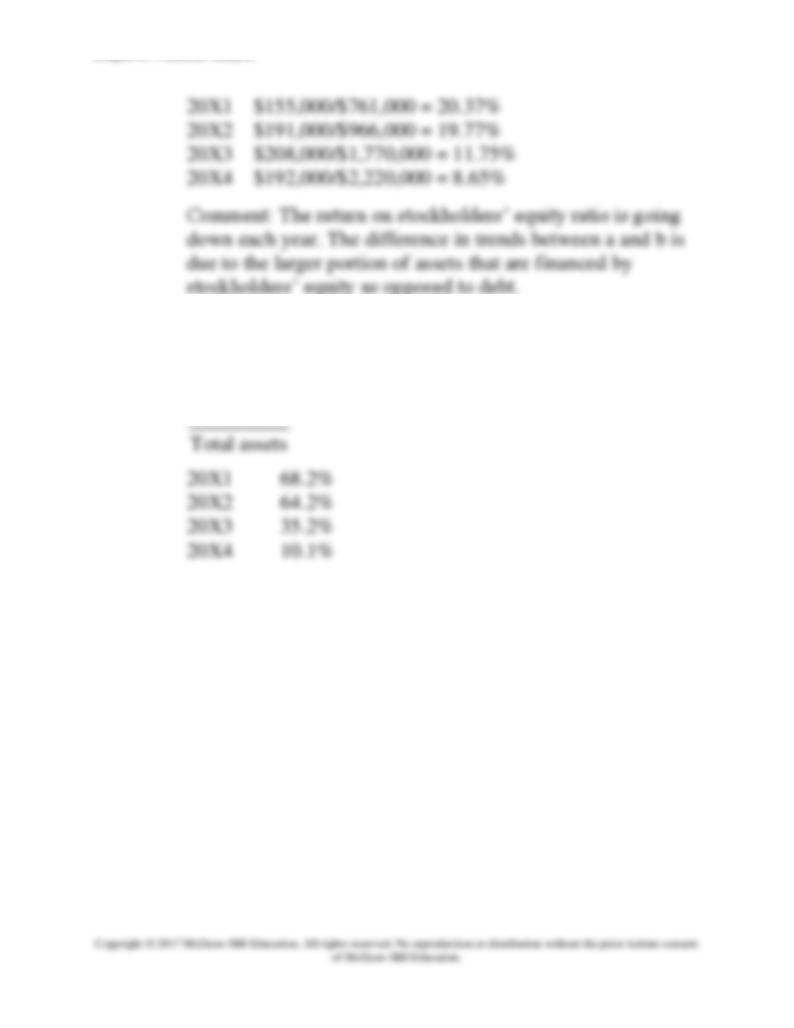
Chapter 03: Financial Analysis
3-27. (Continued)
Optional: This can be confirmed by computing total debt to
total assets for each year.
Total debt
Chapter 03: Financial Analysis
28. Trend analysis (LO4) Quantum Moving Company has the following data. Industry
information also is shown.
Industry Data on
Company Data Net Income/Total Assets
Year Net Income Total Assets
20X1 $424,000 $2,843,000 14.0%
Quantum Moving Company
a. Net income/total assets
Although the company has shown a declining return on assets
since 20X1, it has performed much better than the industry.
Praise may be more appropriate than criticism.
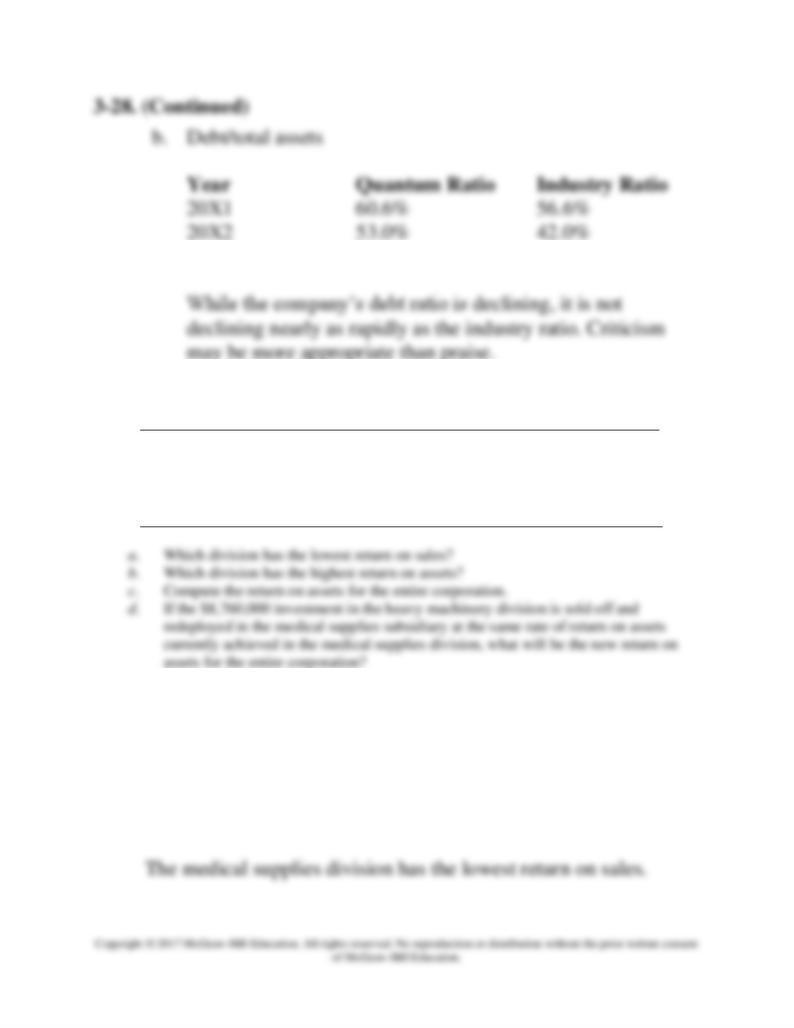
Chapter 03: Financial Analysis
20X3
50.9%
38.0%
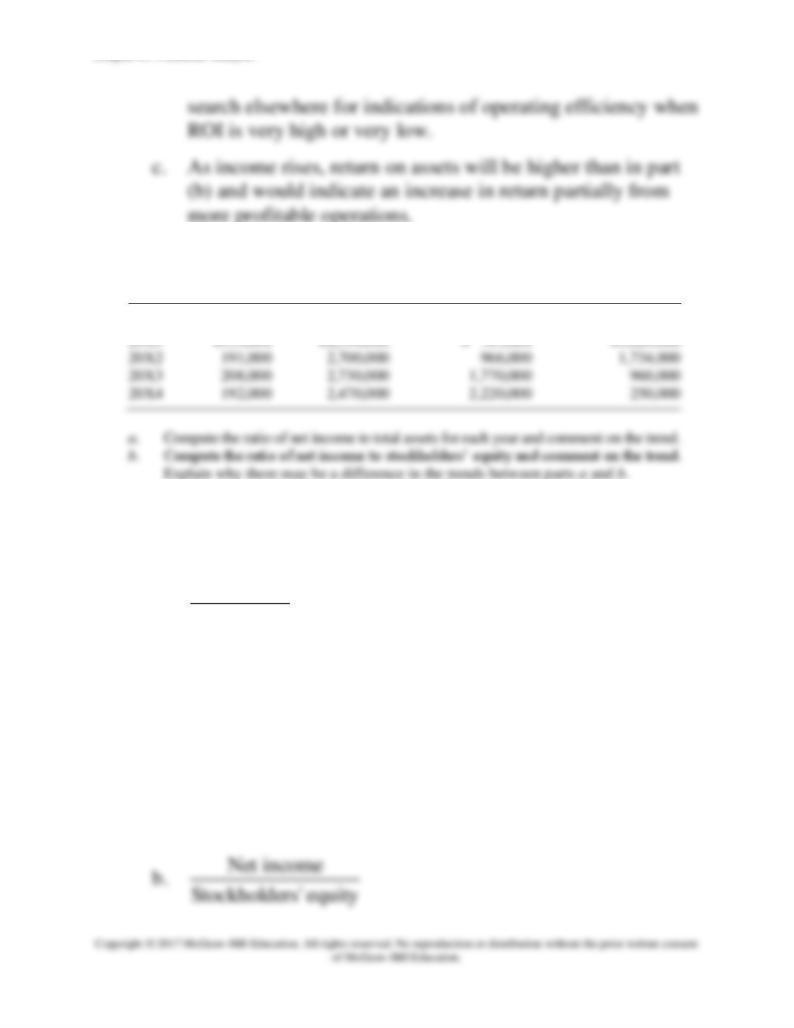
29. Analysis by divisions (LO2) The Global Products Corporation has three subsidiaries.
Medical Supplies Heavy Machinery Electronics
Sales ....................................... $20,040,000 $5,980,000 $4,730,000
Net income (after taxes) ......... 1,700,000 592,000 402,000
Assets ..................................... 8,340,000 8,760,000 3,570,000
.
3-29. Solution:
Global Products Corporation
a. Medical Heavy
Supplies Machinery Electronics
Net income/Sales 8.48% 9.90% 8.50%
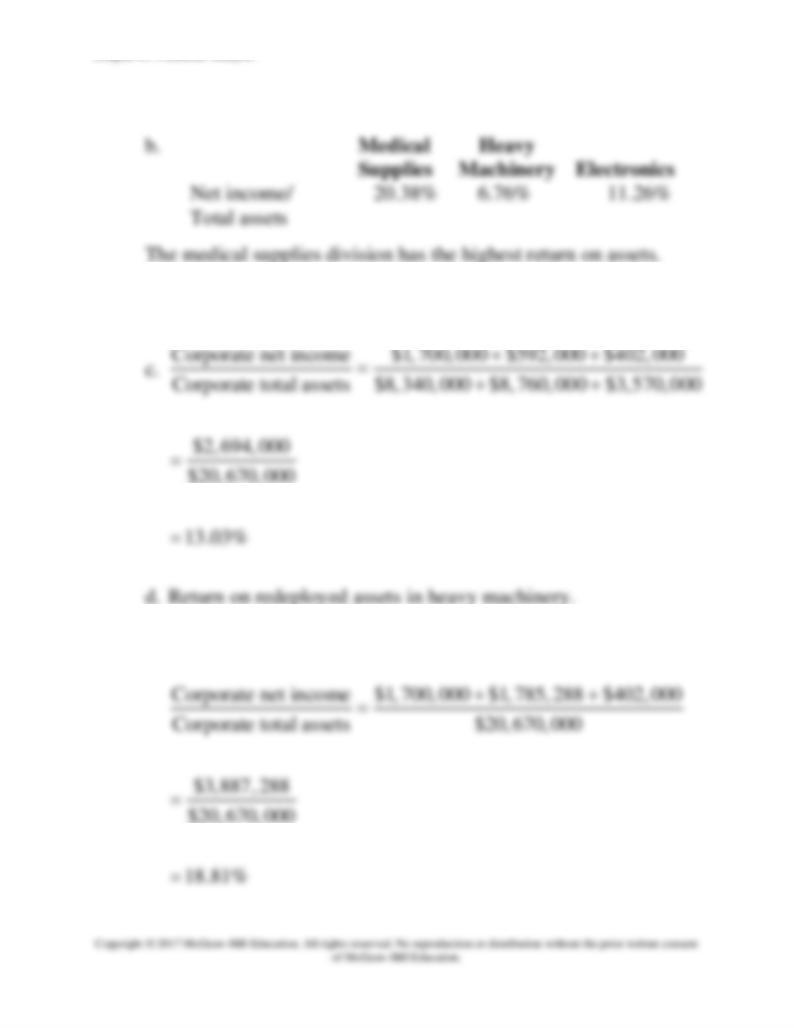
Chapter 03: Financial Analysis
3-29. (Continued)
20.38% × $8,760,000 = $1,785,288
Return on assets for the entire corporation:
Chapter 03: Financial Analysis
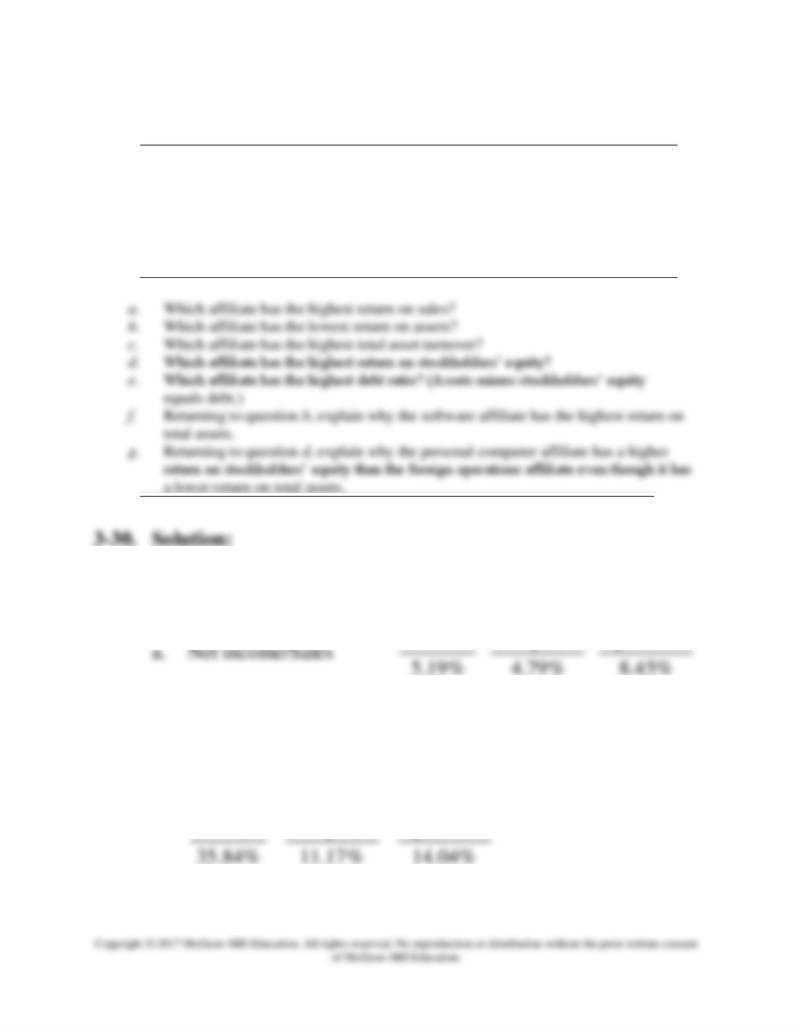
30. Analysis by affiliates (LO1) Omni Technology Holding Company has the following three
affiliates:
Personal Foreign
Software Computers Operations
Sales ................................. $40,200,000 $60,080,000 $100,680,000
Net income (after taxes) ... 2,086,000 2,880,000 8,510,000
Assets ............................... 5,820,000 25,790,000 60,630,000
Stockholders’ equity ........ 4,090,000 10,170,000 50,950,000
Omni Technology Holding Company
Personal Foreign
Software Computers Operations
The foreign operation affiliate has the highest return on sales.
b. Net income/Total assets
Personal Foreign
Software Computers Operations
The personal computer affiliate has the lowest return on
assets.
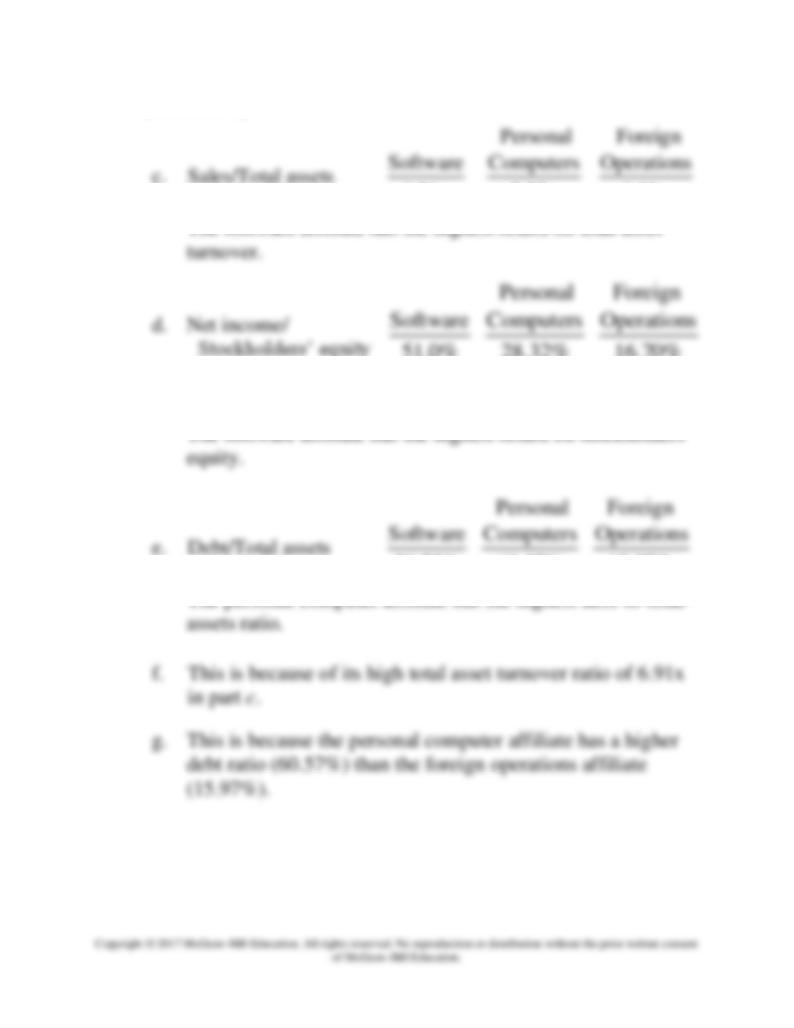
Chapter 03: Financial Analysis
3-30. (Continued)
6.91x 2.33x 1.66x
29.73% 60.57% 15.97%
51.0% 28.32% 16.70%
Chapter 03: Financial Analysis
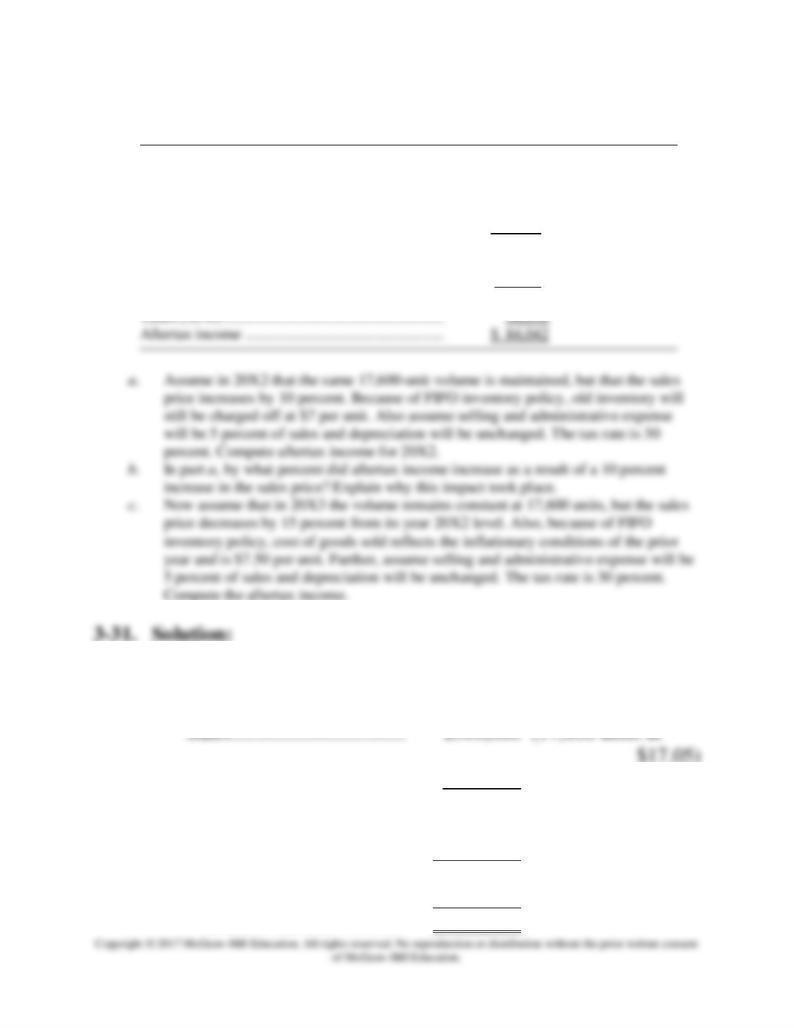
31. Inflation and inventory accounting effect (LO5) The Canton Corporation shows the
following income statement. The firm uses FIFO inventory accounting.
CANTON CORPORATION
Income Statement for 20X1
Sales ..................................................................... $272,800 (17,600 units at $15.50)
Cost of goods sold ................................................ 123,200 (17,600 units at $7.00)
Gross profit .......................................................... 149,600
Selling and administrative expense ...................... 13,640
Depreciation ......................................................... 15,900
Operating profit .................................................... 120,060
Canton Corporation
a. 20X2
Cost of goods sold ............ 123,200 (17,600 units at $7)
Gross profit .................... $ 176,880
Selling and adm. expense 15,004 (5% of sales)
Depreciation ..................... 15,900
Operating profit ............. $ 145,976
Taxes (30%) ..................... $ 43,793
Aftertax income ............. $ 102,183
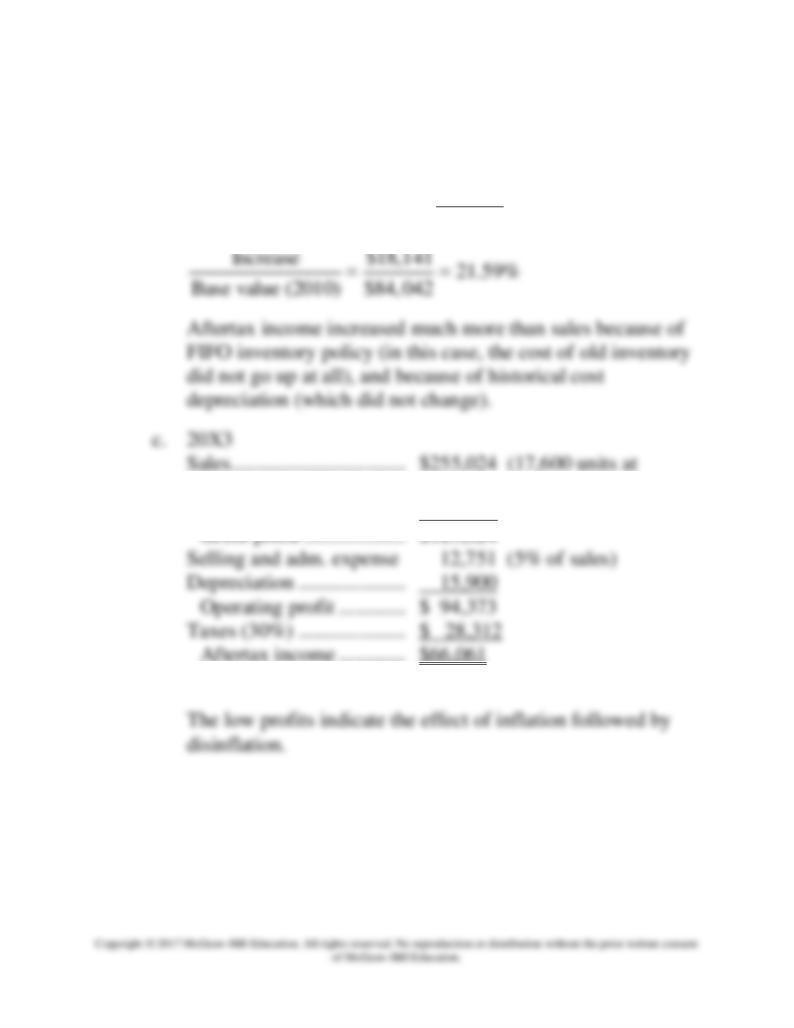
Chapter 03: Financial Analysis
3-31. (Continued)
b. Gain in aftertax income
20X2 $102,183
20X1 84,042
Increase $18,141
$14.49*)
Cost of goods sold ............ 132,000 (17,600 units at $7.50)
*$17.05 × 0.85 = $14.49
Chapter 03: Financial Analysis
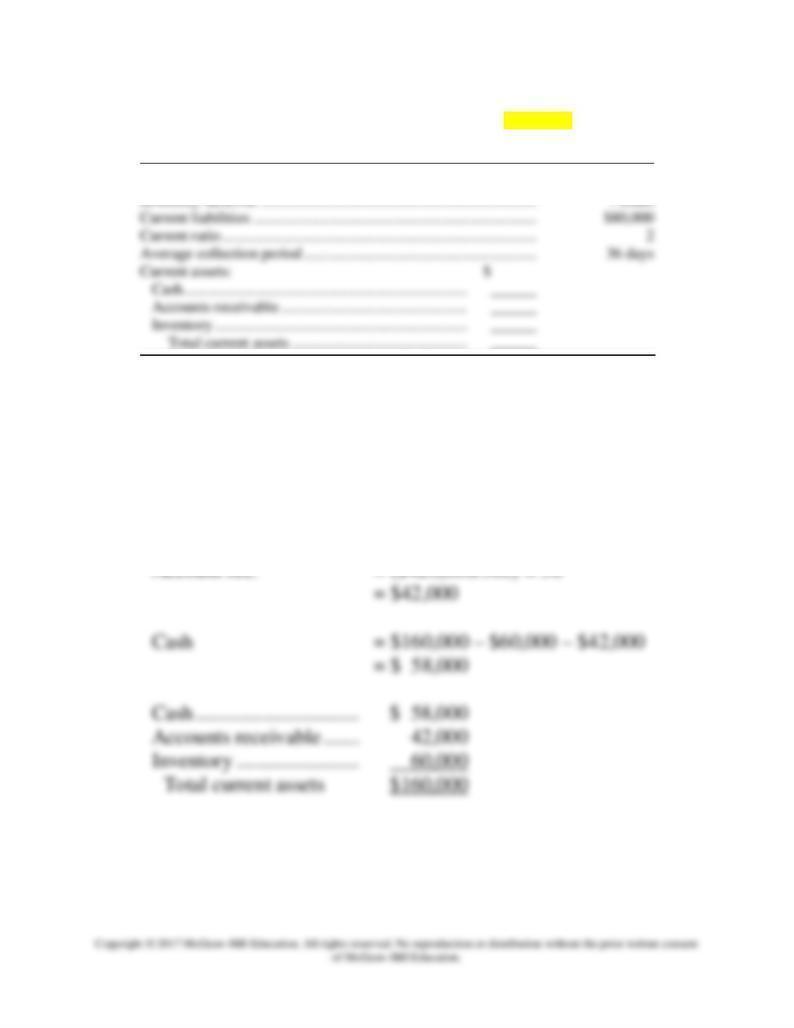
32. Using ratios to construct financial statements (LO2) Construct the current assets section
of the balance sheet from the following data. (Use cash as a plug figure after computing the
other values.)
Yearly sales (credit) ..................................................................... $420,000
3-32. Solution:
Inventory = $420,000/7
= $60,000
Current assets = 2 × $80,000
= $160,000
Chapter 03: Financial Analysis
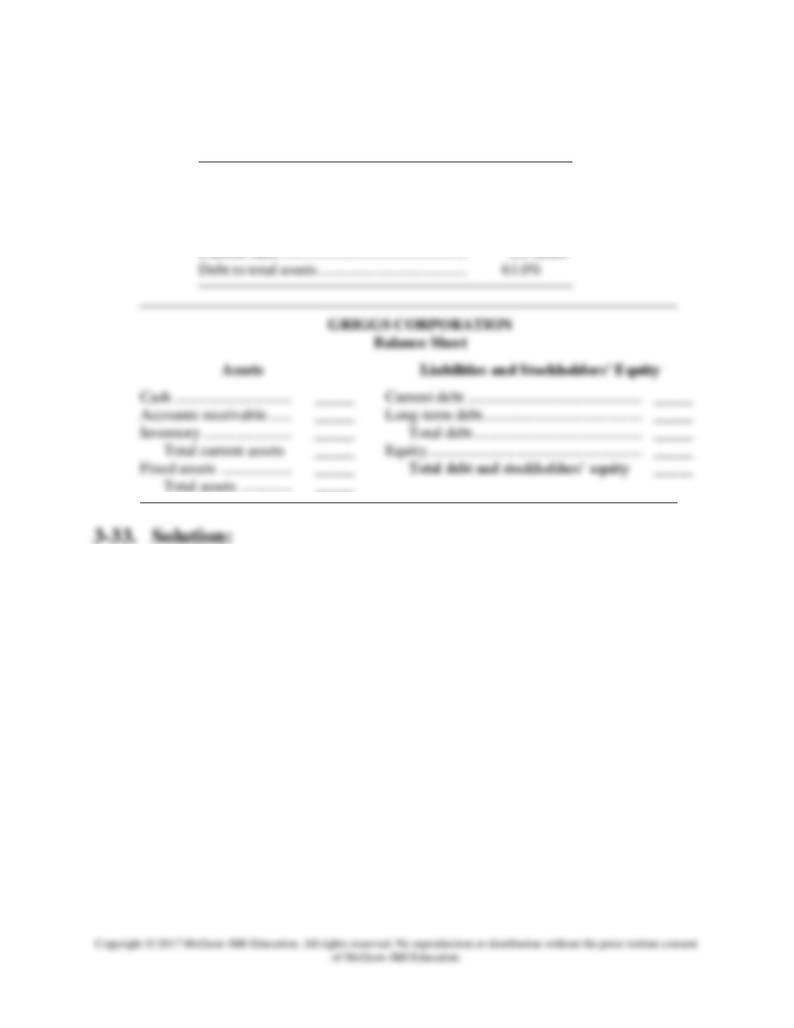
33. Using ratios to construct financial statements (LO2) The Griggs Corporation has credit
sales of $1,200,000. Given these ratios, fill in the following balance sheet.
Total assets turnover ................................... 2.4 times
Cash to total assets ...................................... 2.0%
Accounts receivable turnover ..................... 8.0 times
Inventory turnover ...................................... 10.0 times
Griggs Corporation
Sales/Total assets = 2.4 times
Total assets = $1,200,000/2.4
Total assets = $500,000
Cash = 2% of total assets
Cash = 2% × $500,000
Cash = $10,000
Sales/Accounts receivable = 8 times
Accounts receivable = $1,200,000/8
Accounts receivable = $150,000
Sales/Inventory = 10 times
Inventory = $1,200,000/10
Inventory = $120,000
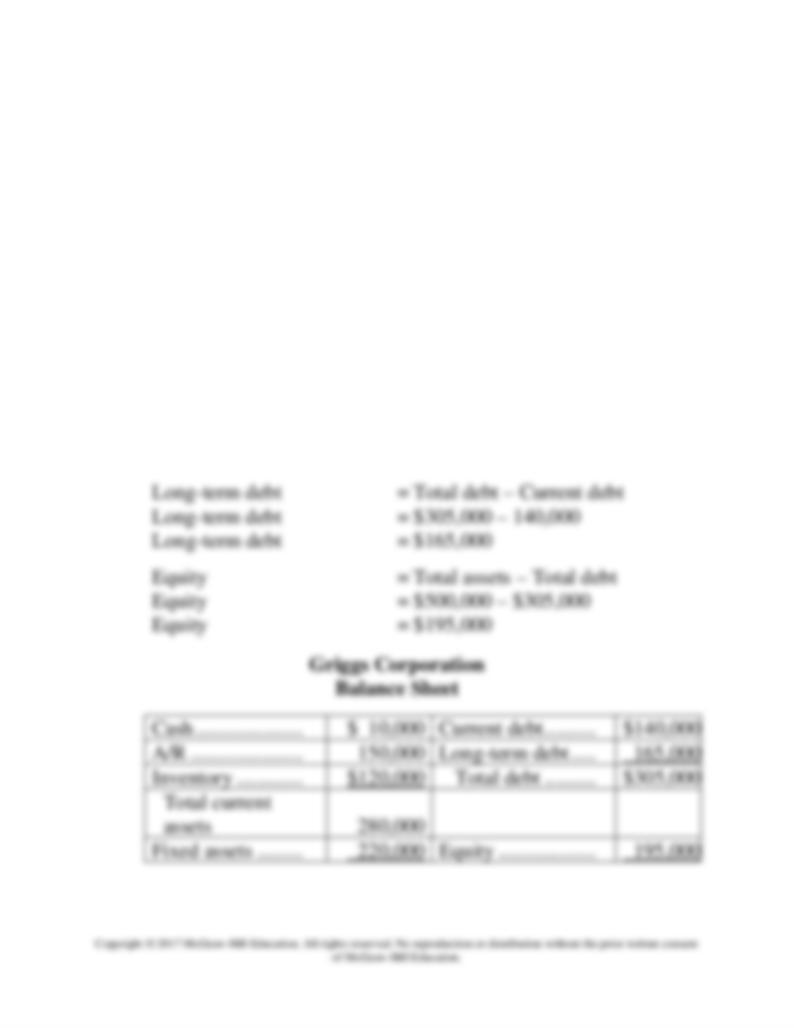
Chapter 03: Financial Analysis
3-33. (Continued)
Fixed assets = Total assets – Current assets
Current asset = $10,000 + $150,000 +
$120,000 = $280,000
Fixed assets = $500,000 – $280,000
= $220,000
Current assets/Current debt = 2
Current debt = Current assets/2
Current debt = $280,000/2
Current debt = $140,000
Total debt/Total assets = 61%
Total debt = 0.61 × $500,000
Total debt = $305,000
Chapter 03: Financial Analysis
Total assets ..........
$500,000
Total debt and
stockholders’
equity
$500,000
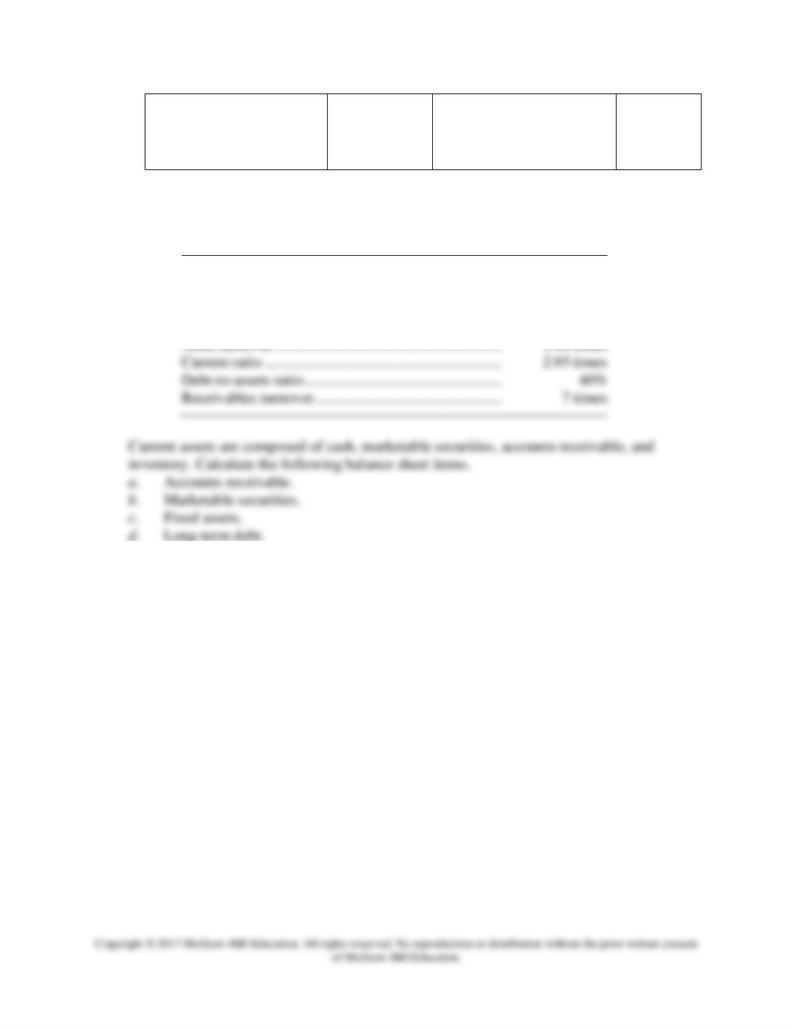
34. Using ratios to determine account balances (LO2) We are given the following
information for the Pettit Corporation.
Sales (credit) ............................................................. $3,549,000
Cash .......................................................................... 179,000
Inventory .................................................................. 911,000
Current liabilities ...................................................... 788,000
3-34. Solution:
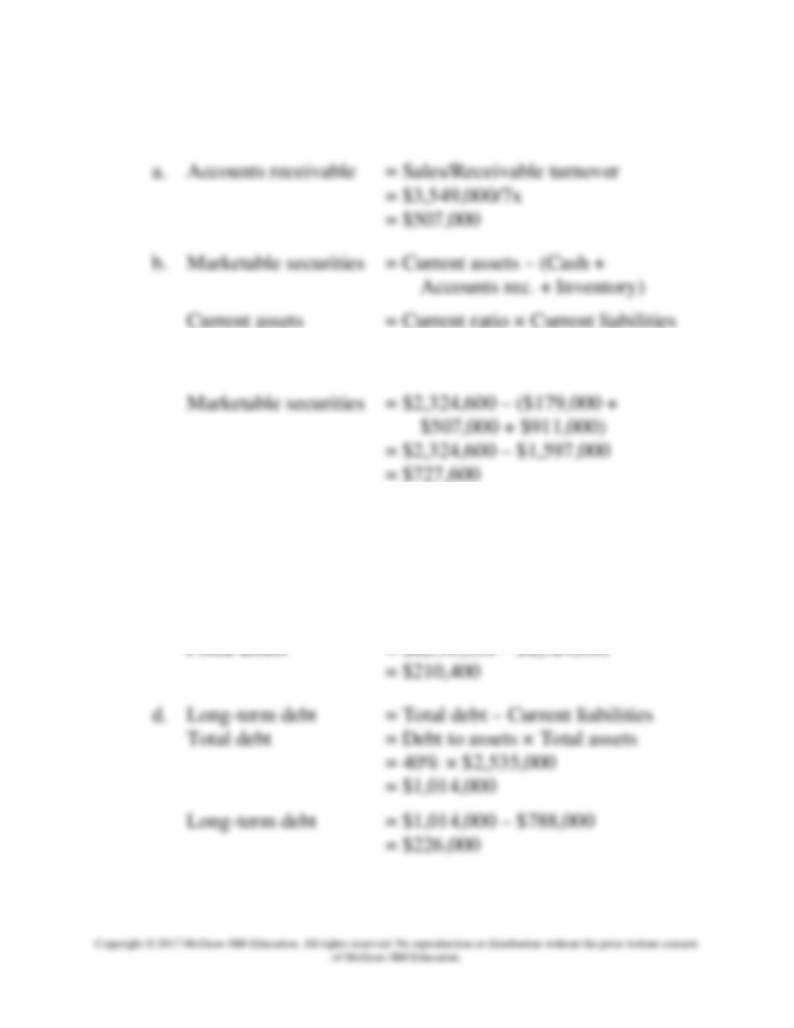
Chapter 03: Financial Analysis
Pettit Corporation
= 2.95 × $788,000
= $2,324,600
3-34. (Continued)
c. Fixed assets = Total assets – Current assets
Total assets = Sales/Asset turnover
= $3,549,000/1.40x
= $2,535,000
Chapter 03: Financial Analysis
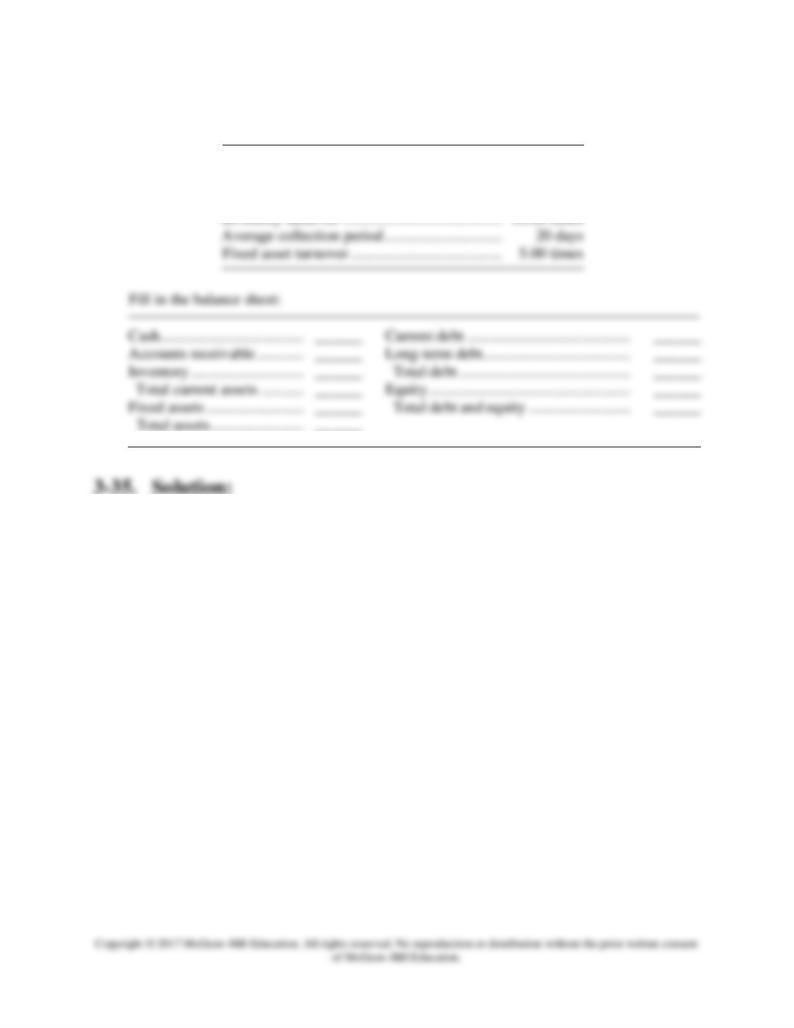
35. Using ratios to construct financial statements (LO2) The following information is from
Harrelson Inc.’s, financial statements. Sales (all credit) were $28.50 million for last year.
Sales to total assets......................................... 1.90 times
Total debt to total assets ................................. 35%
Current ratio ................................................... 2.50 times
Harrelson Inc.
Sales/Total assets = 1.90
Total assets = $28.50 million/1.90
Total assets = $15 million
Total debt/Total assets = 35%
Total debt = $15 million × .35
Total debt = $5.25 million
Sales/inventory = 10x
Inventory = $28.50 million/10x
Inventory = $2.85 million
Average daily sales = $28.50 million/360 days
= $79,166.67 per day
Accounts receivable = 20 days × $79,166.67
= $1.58 million (or)
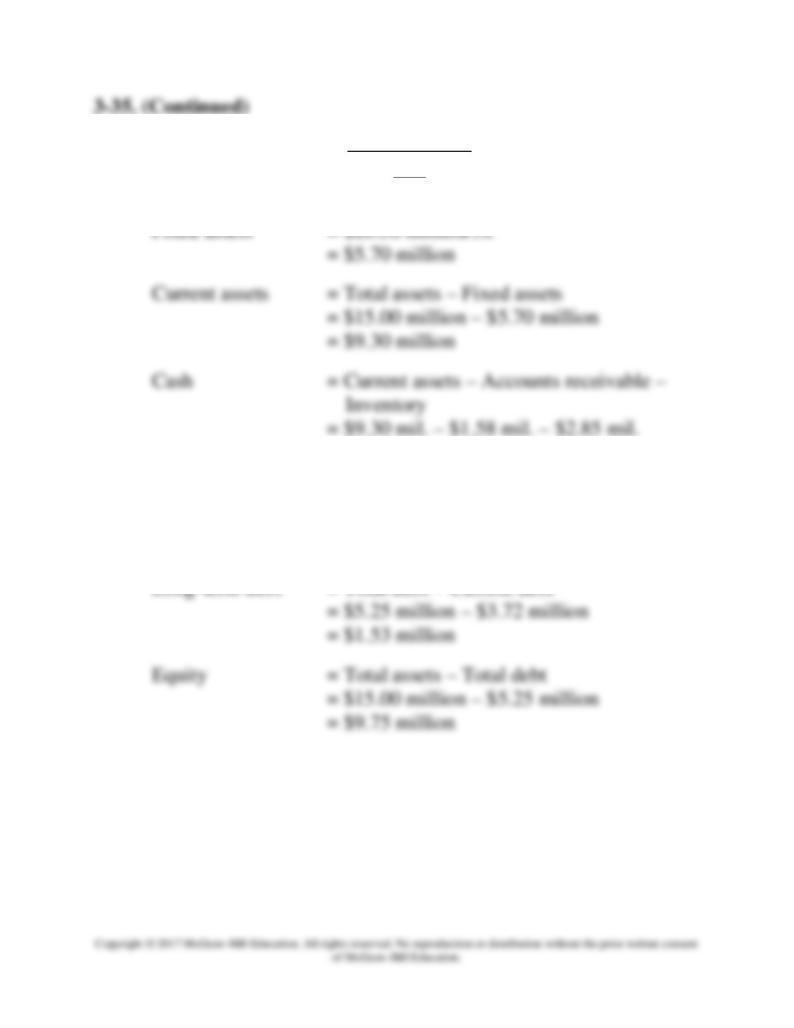
Chapter 03: Financial Analysis
$28.50 million
Accounts receivable = $1,583,333
360
20
=
= $4.87 million
Current liabilities = Current assets/2.50
= $9.30 million/2.50
= $3.72 million
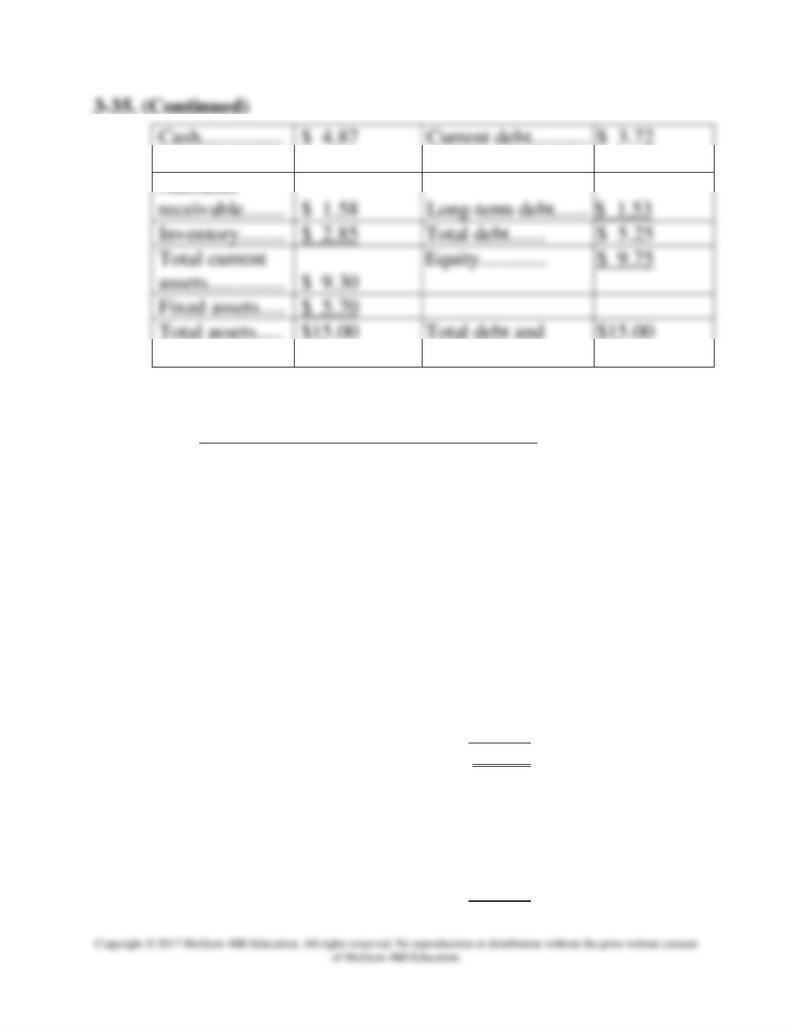
Chapter 03: Financial Analysis
million
million
million
equity...........
million
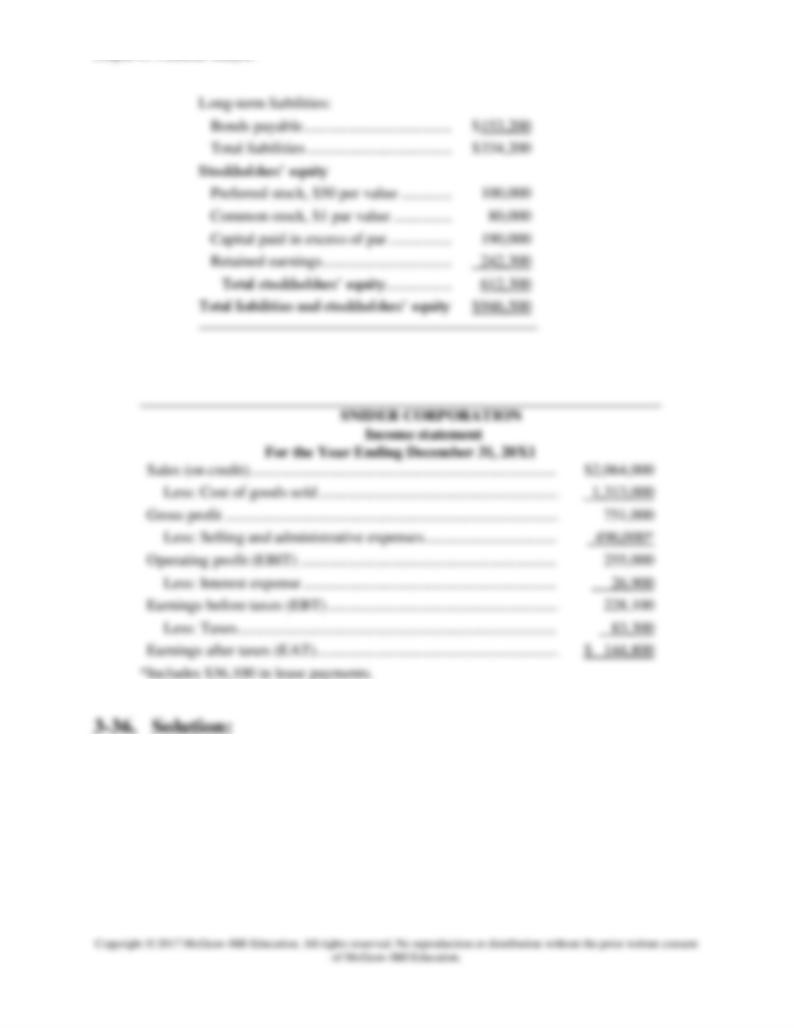
36. Comparing all the ratios (LO2) Using the financial statements for the Snider Corporation,
calculate the 13 basic ratios found in the chapter.
SNIDER CORPORATION
Balance Sheet
December 31, 20X1
Assets
Current assets:
Cash...................................................... $ 52,200
Marketable securities ........................... 24,400
Accounts receivable (net) .................... 222,000
Inventory .............................................. 238,000
Total current assets ........................... $536,000
Investments ............................................. 65,900
Plant and equipment................................ 615,000
Less: Accumulated depreciation .......... (271,000)
Net plant and equipment ...................... 344,000
Total assets .............................................. $946,500
Liabilities and Stockholders’ Equity
Current liabilities
Accounts payable ................................. $93,400
Notes payable ....................................... 70,600
Accrued taxes ....................................... 17,000
Total current liabilities ...................... 181,000
Chapter 03: Financial Analysis
Snider Corporation
Profitability ratios
Profit margin = $144,800/$2,064,000 = 7.02%
Return on assets (investment) = $144,800/$946,500 = 15.3%
Return on equity = $144,800/$612,300 = 23.65%
Assets utilization ratios
Chapter 03: Financial Analysis
Receivable turnover = $2,064,000 /$222,000 = 9.30x
Average collection period = $222,000/$5,733 = 38.72 days
Inventory turnover = $2,064,000 /$238,000 = 8.67x
Fixed asset turnover = $2,064,000 /$344,000 = 6.00x
Total asset turnover = $2,064,000 /$946,500 = 2.18x
Liquidity ratio
Current ratio = $536,600/$181,000 = 2.96x
Quick ratio = $298,600/$181,000 = 1.65x
Debt utilization ratios
Debt to total assets = $334,200/$946,500 = 35.31%
Times interest earned = $255,000/$26,900 = 9.48x
Fixed charge coverage = $291,100/$63,000 = 4.62x
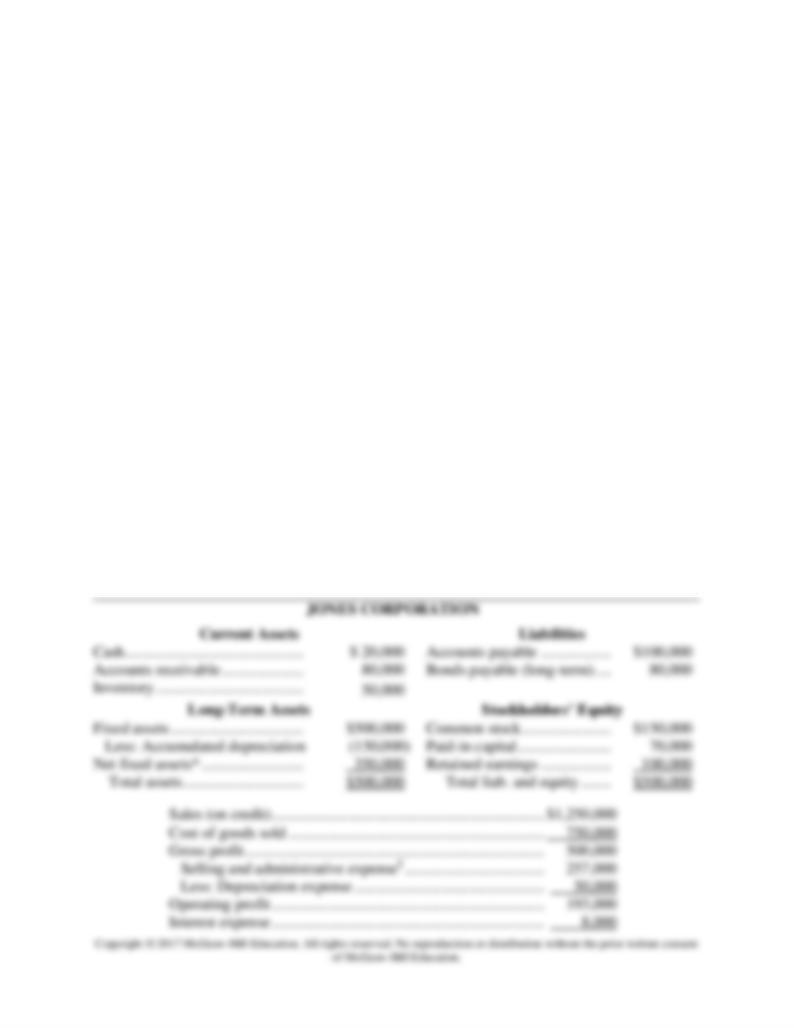
37. Ratio computation and analysis (LO2) Given the financial statements for Jones
Corporation and Smith Corporation shown here:
a. To which one would you, as credit manager for a supplier, approve the extension of
(short-term) trade credit? Why? Compute all ratios before answering.
b. In which one would you buy stock? Why?
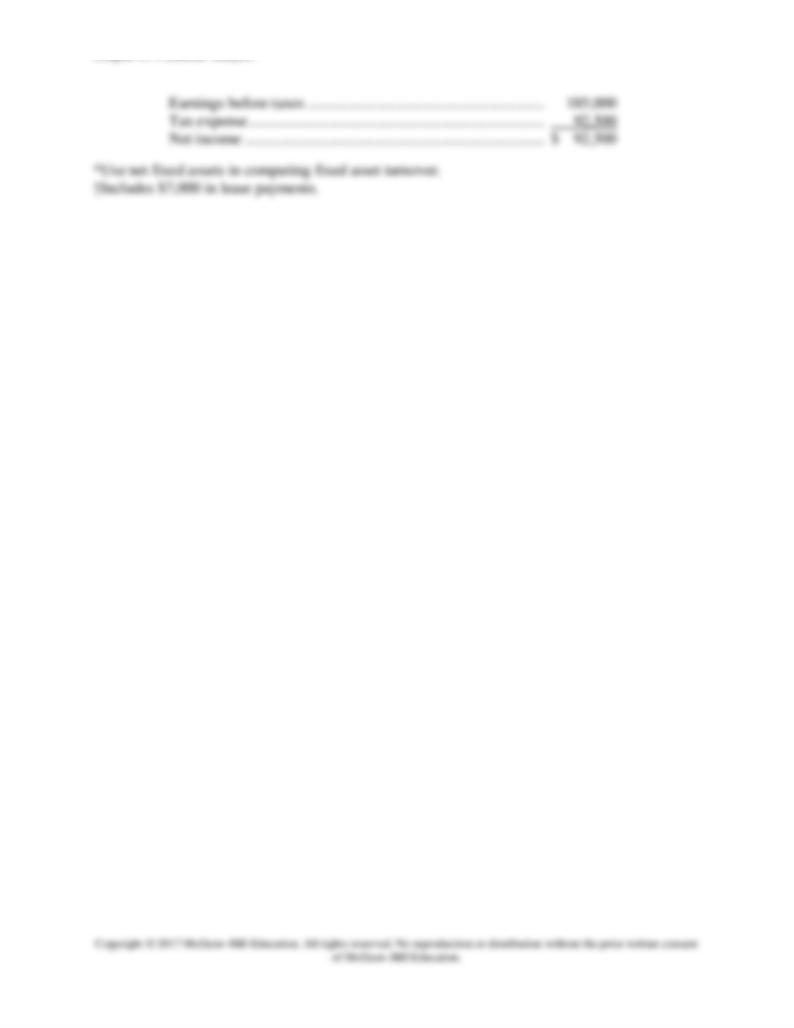
Chapter 03: Financial Analysis

Chapter 03: Financial Analysis
Jones and Smith Comparison
One way of analyzing the situation for each company is to
compare the respective ratios for each. Examining those ratios
which would be most important to a supplier or short-term lender
and a stockholder.
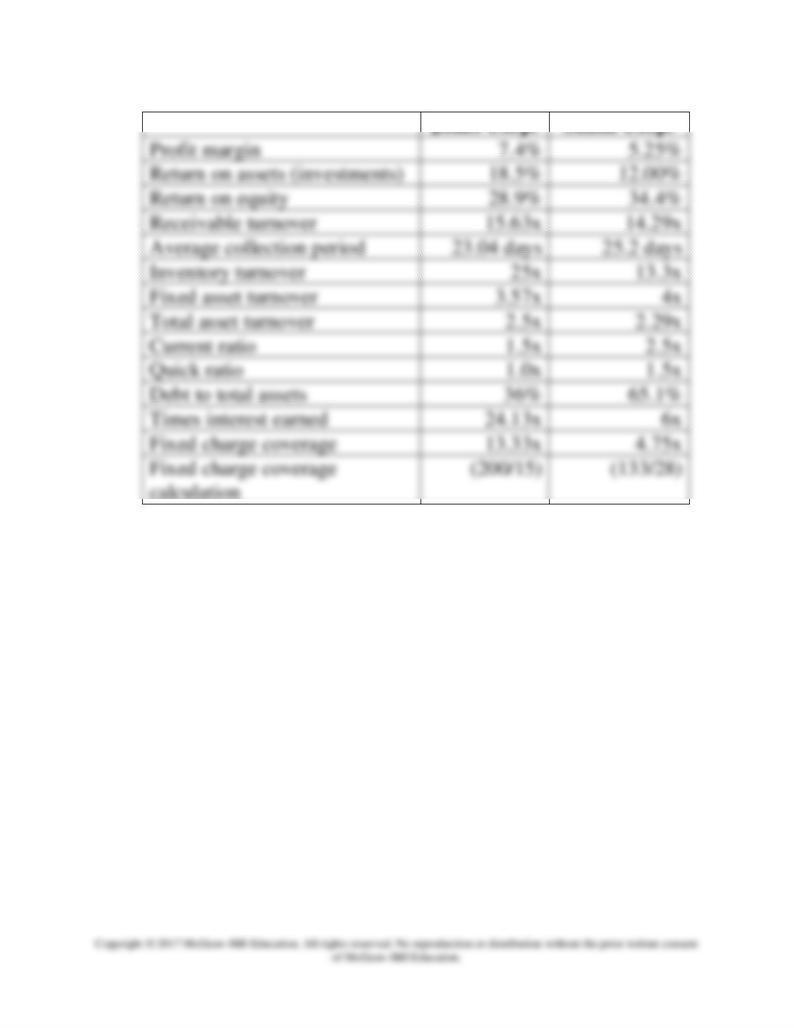
Chapter 03: Financial Analysis
3-37. (Continued)
a. Since suppliers and short-term lenders are most concerned with
liquidity ratios, Smith Corporation would get the nod as having
the best ratios in this category. One could argue, however, that
Smith had benefited from having its debt primarily long term
rather than short term. Nevertheless, it appears to have better
liquidity ratios.
b. Stockholders are most concerned with profitability. In this
category, Jones has much better ratios than Smith. Smith does
have a higher return on equity than Jones, but this is due to its
much larger use of debt. Its return on equity is higher than
Jones’ because it has taken more financial risk. In terms of other
ratios, Jones has its interest and fixed charges well covered and
in general its long-term ratios and outlook are better than
Smith’s. Jones has asset utilization ratios equal to or better than
Chapter 03: Financial Analysis
Smith and its lower liquidity ratios could reflect better short-term
asset management. This point was covered in part a.
Note: Remember that, in order to make actual financial decisions,
more than one year’s comparative data is usually required. Industry
comparisons should also be made.
SMITH CORPORATION
Sales (on credit) ..........................................
$1,000,000
Cost of goods sold .......................................
600,000
Gross profit ..................................................
400,000
Selling and administrative expense..........
224,000
Less: Depreciation expense .......................
50,000
Operating profit ...........................................
126,000
Chapter 03: Financial Analysis
Earnings per share ...............................................
$ 2.94
$ 3.06
$ 3.15
*Includes $15,000 in lease payments for each year.
Exhibit 2
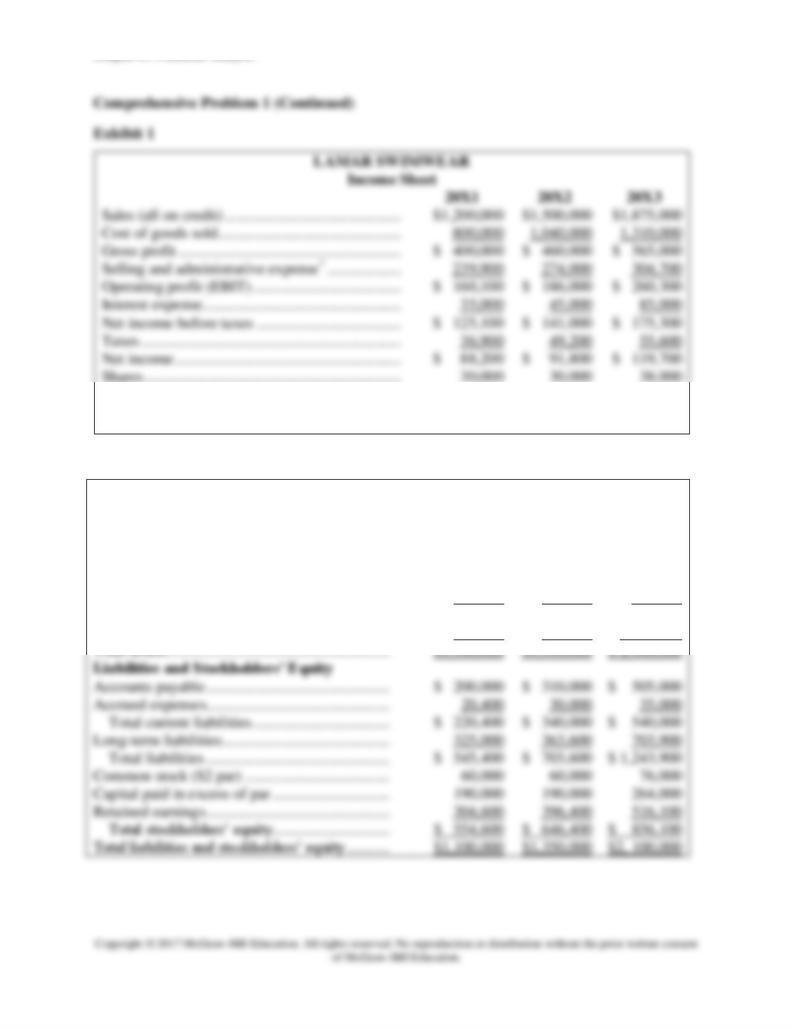
LAMAR SWIMWEAR
Balance Sheet
Assets
20X1
20X2
20X3
Cash....................................................................
$ 30,000
$ 40,000
$ 30,000
Marketable securities .........................................
20,000
25,000
30,000
Accounts receivable ...........................................
170,000
259,000
360,000
Inventory ............................................................
230,000
261,000
290,000
Total current assets ........................................
$ 450,000
$ 585,000
$ 710,000
Net plant and equipment ....................................
650,000
765,000
1,390,000
Chapter 03: Financial Analysis
Growth in EPS ...................................
—
10.10%
13.30%
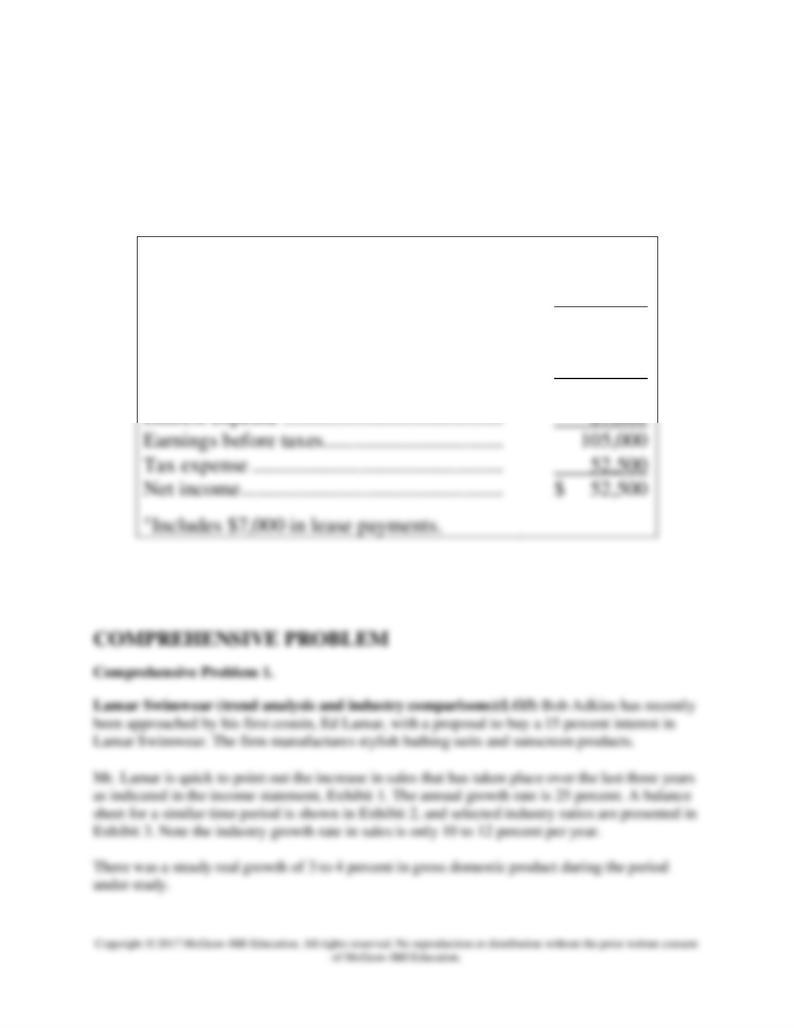
The stock in the corporation has become available due to the ill health of a current stockholder,
who is in need of cash. The issue here is not to determine the exact price for the stock, but rather
whether Lamar Swimwear represents an attractive investment situation. Although Mr. Adkins
has a primary interest in the profitability ratios, he will take a close look at all the ratios. He has
no fast and firm rules about required return on investment, but rather wishes to analyze the
overall condition of the firm. The firm does not currently pay a cash dividend, and return to the
investor must come from selling the stock in the future. After doing a thorough analysis
(including ratios for each year and comparisons to the industry), what comments and
recommendations do you offer to Mr. Adkins?
Chapter 03: Financial Analysis
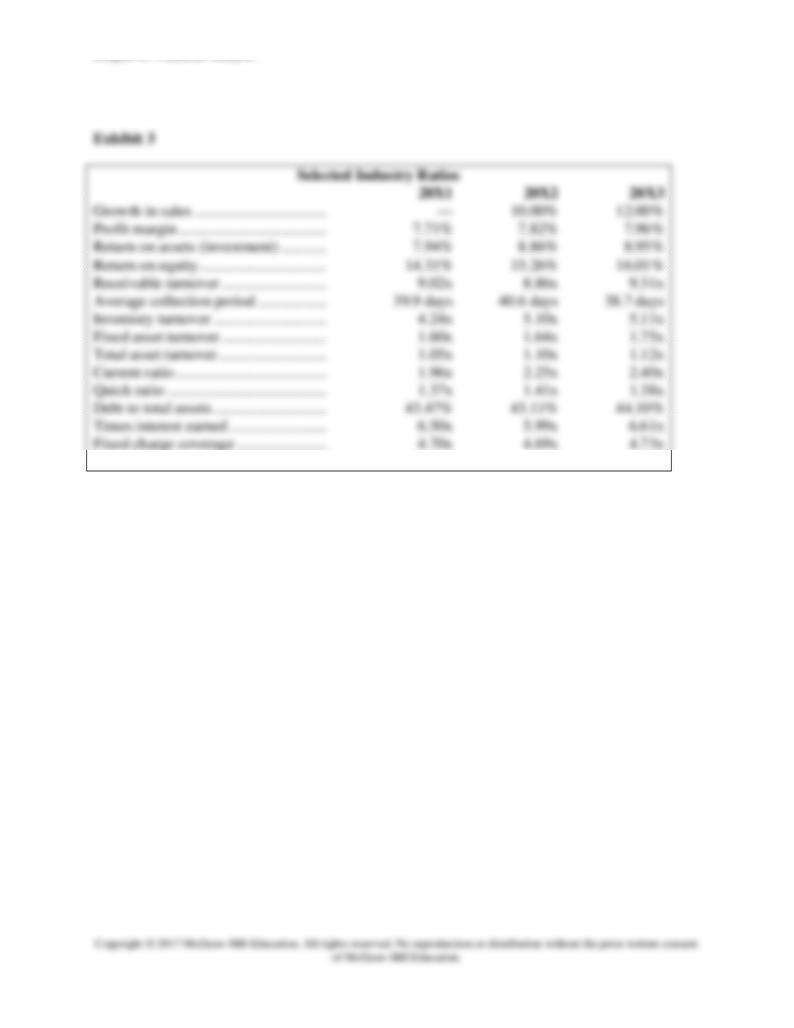
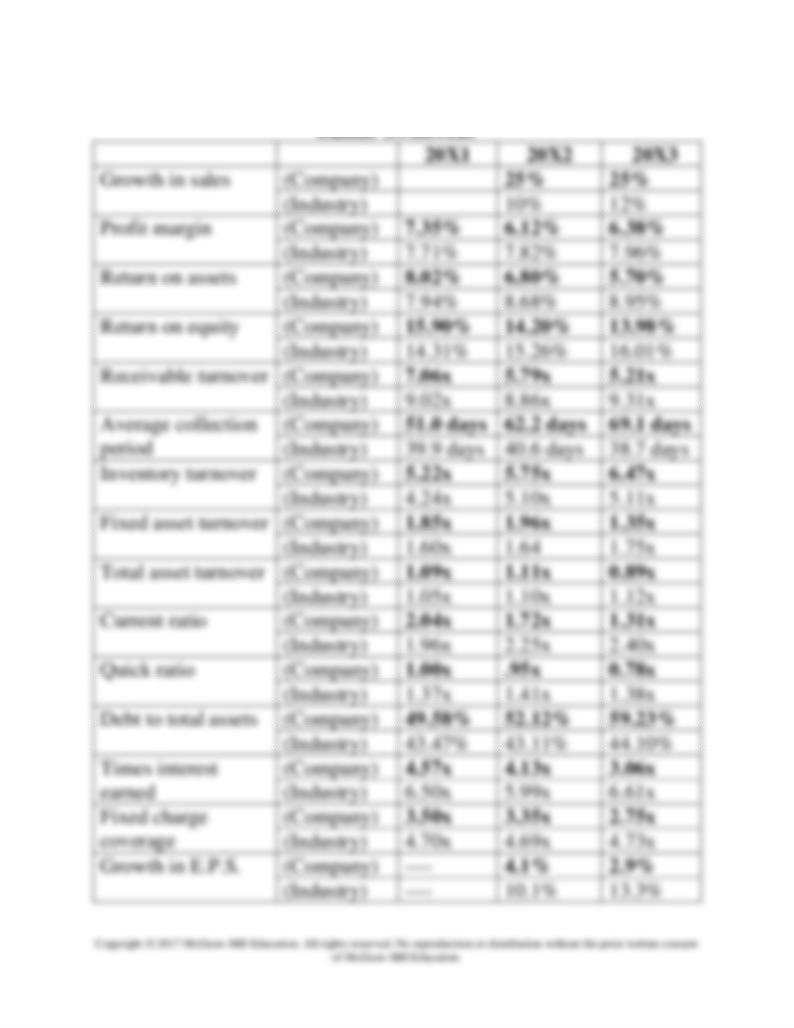
CP 3-1. Solution: Lamar Swimwear
Chapter 03: Financial Analysis
CP 3-1. (Continued)
Discussion of Ratios
While Lamar Swimwear is expanding its sales much more rapidly than
others in the industry, there are some clear deficiencies in their
performance. These can be seen in terms of a trend analysis over time as
well as a comparative analysis with industry data.
In terms of profitability, the profit margin is declining over time. This is
surprising in light of the 56.25 percent increase in sales over two years
(25 percent per year). There obviously are no economies of scale for this
firm. Higher costs of goods sold and interest expense appear to be
causing the problem. The return-on-asset ratio starts out in 20X1 above
the industry average (8.02 percent versus 7.94 percent) and ends up well
in 113.8 percent in fixed assets (representing $740,000).
Chapter 03: Financial Analysis
Chapter 03: Financial Analysis
CP 3-1. (Continued)
(59.23 percent versus 44.10 percent). Their heavy debt position is clearly
out of line with their competitors. Their downtrend in times interest
earned and fixed charge coverage confirms the heavy debt burden on the
company.
Finally, we see that the firm has a slower growth rate in earnings per
share than the industry. This is a function of less rapid growth in
earnings as well as an increase in shares outstanding (with the sale of
8,000 shares in 20X3). Once again, we see that the rapid growth in sales
is not being translated down into significant earnings gains. This is true
in spite of the fact that there is a very stable economic environment.
Investment Comments:
He would probably have difficulty justifying such an investment based
on the performance of the firm. There are no dividend payouts, so return
to the investor would have to come in the form of capital appreciation if
and when he was able to resell the shares. The prospects, at this point,
Chapter 03: Financial Analysis
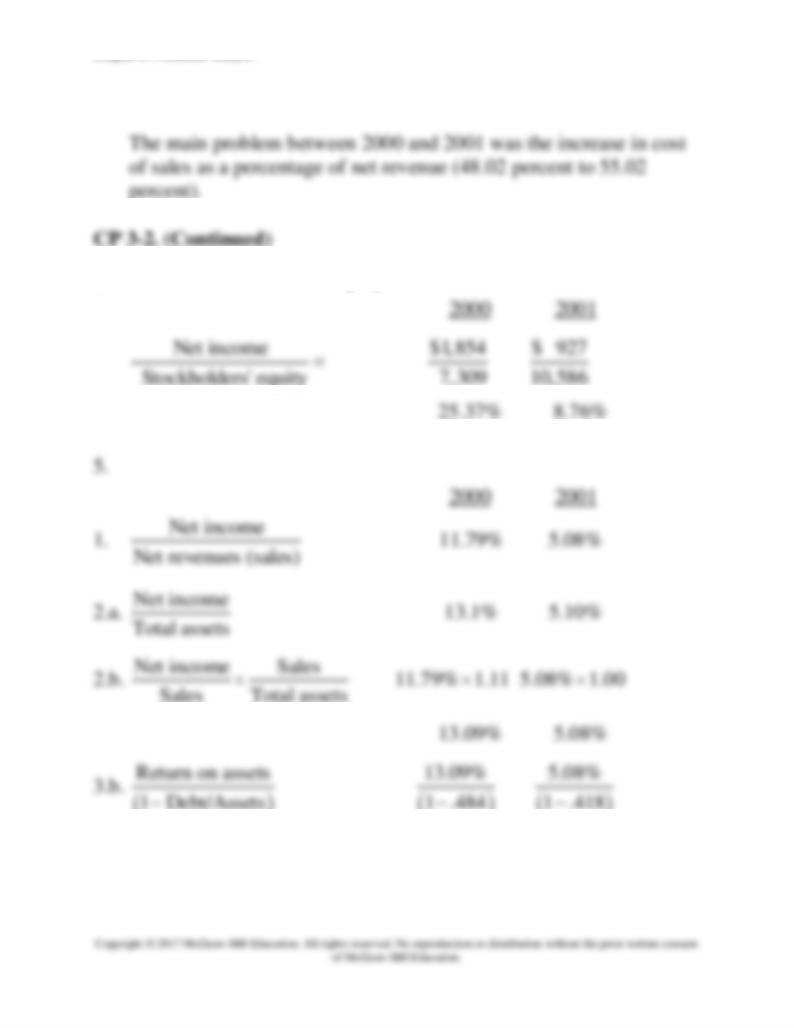
3. What is the major reason for the change in the answer for Question 2 between 2000 and
and 2.
In 2009, Sun Microsystems was acquired by Oracle Corporation.
Chapter 03: Financial Analysis
Comprehensive Problem 2 (Continued)
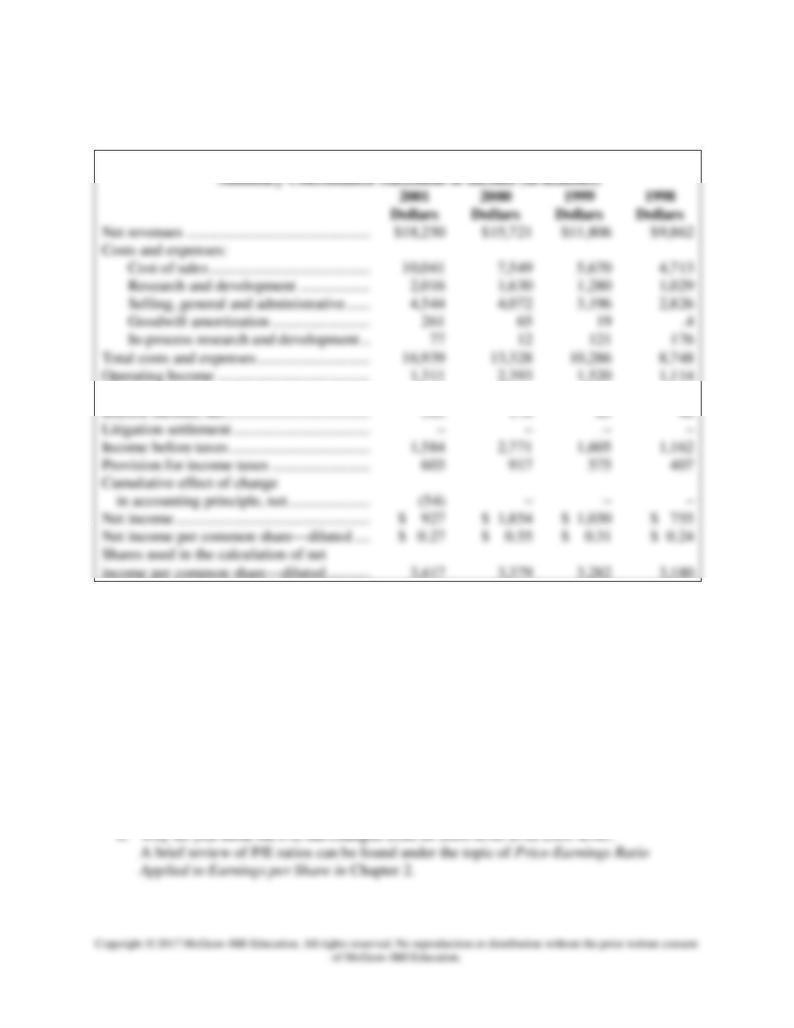
Exhibit 1
SUN MICROSYSTEMS INC.
Gain (loss) on strategic investments ...........
(90)
208
–
–
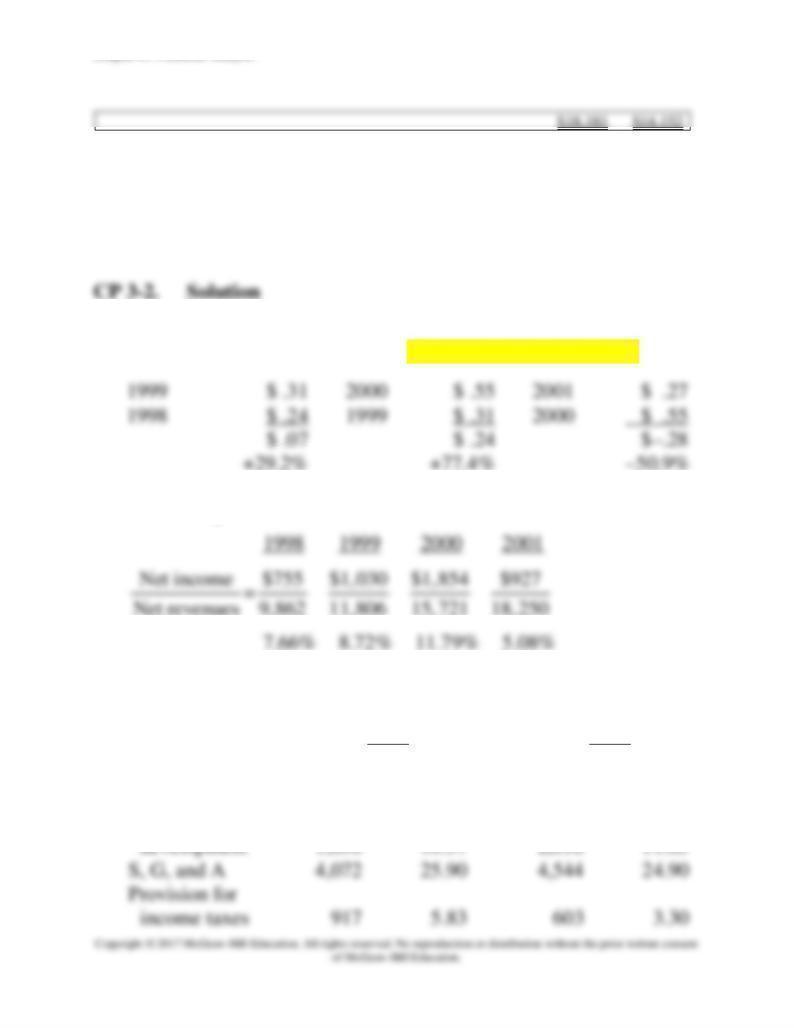
5. Analyze your results to Question 4 more completely by computing ratios 1, 2a, 2b, and 3b
(all from this chapter) for 2000 and 2001. Actually, the answer to ratio 1 can be found as part
of the answer to question 2, but it is helpful to look at it again.
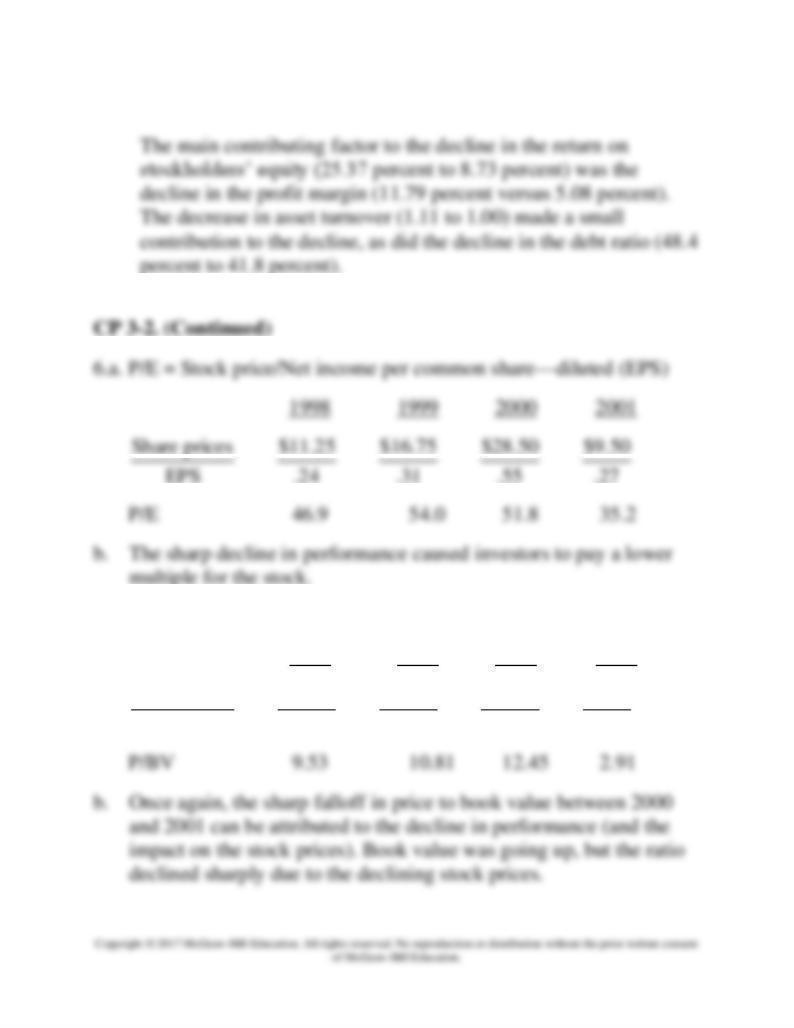
What do you think was the main contributing factor to the change in return on stockholders’
equity between 2000 and 2001? Think in terms of the Du Pont system of analysis.
6. The average stock prices for each of the four years shown in Exhibit 1 were as follows:
1998 11¼
1999 16¾
2000 28½
2001 9½
a. Compute the price/earnings (P/E) ratio for each year. That is, take the stock price shown
above and divide by net income per common stock-dilution from Exhibit 1.
Chapter 03: Financial Analysis
Chapter 03: Financial Analysis
7. The book values per share for the same four years discussed in the preceding question were:
1998 $1.18
1999 $1.55
2000 $2.29
2001 $3.26
a. Compute the ratio of price to book value for each year.
b. Is there any dramatic shift in the ratios worthy of note?
1. Percentage change in net income per common share—diluted
2. Profit margin
3. Percent of net revenue
2000 2001
Net revenues $15,721 $18,250
Cost of sales 7,549 48.02% 10,041 55.02%
Research and
Chapter 03: Financial Analysis
4. Return on stockholders’ equity
( ) ( ) ( )
25.37% 8.73%
Chapter 03: Financial Analysis
7.a. Price to book value = Stock price/book value
1998 1999 2000 2001
Share prices $11.25 $16.75 $28.50 $9.50
Book value 1.18 1.55 2.29 3.26