3. a 6.
(+) ÷2
c
Chapter 12, SE 1.
=
=
CHAPTER 12—Solutions
The Statement of Cash Flows
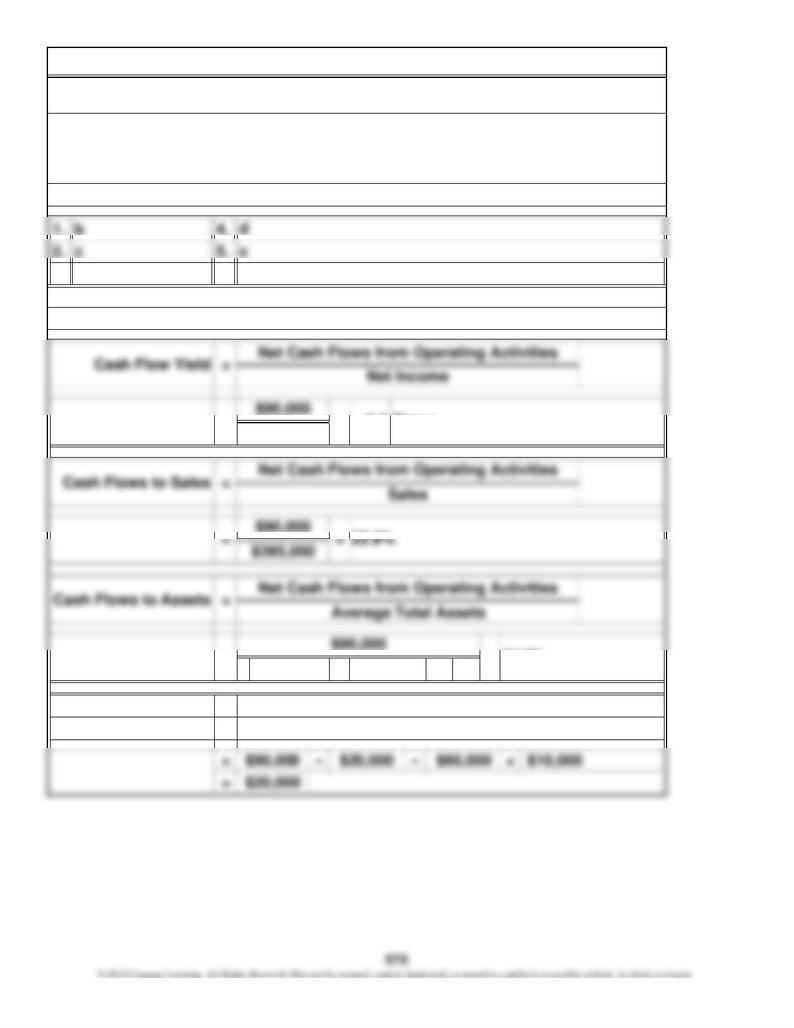
Chapter 12, SE 2.
=
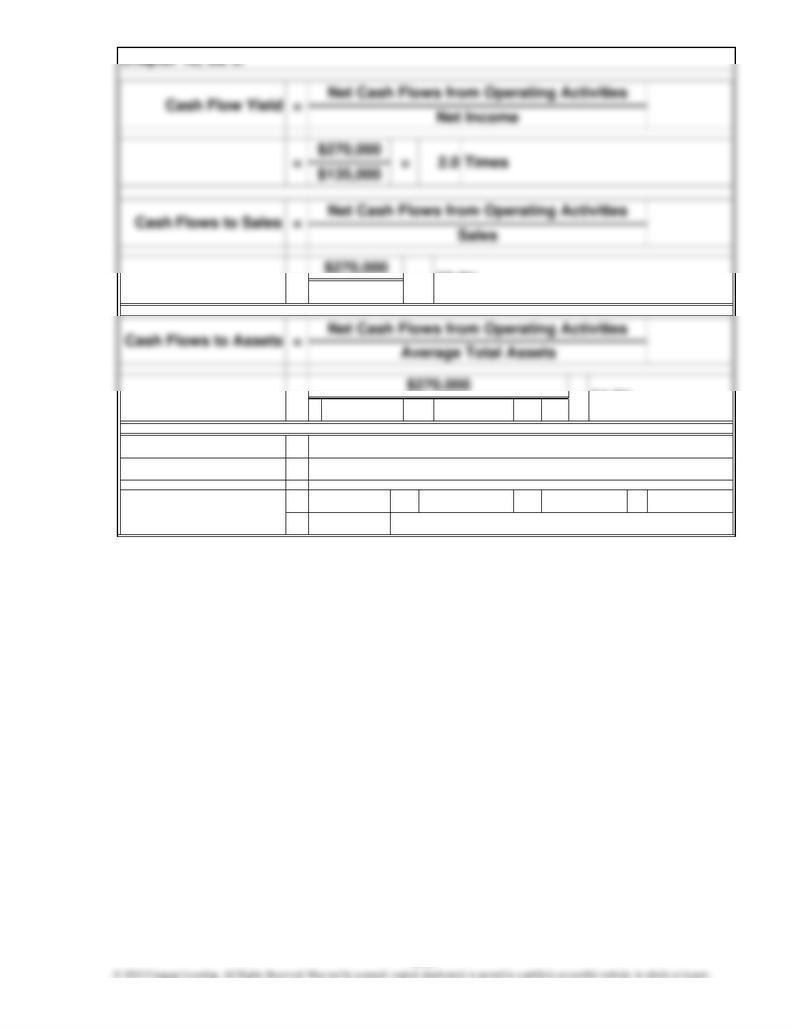
Free Cash Flow
= 2.0 Times
$275,000
Net Cash Flows from Operating Activities – Dividends –
$250,000
34.3%
$45,000
=
Purchases of Plant Assets + Sales of Plant Assets
() ÷2
– + $30,000
Chapter 12, SE 3.
$1,185,000
=
$180,000$270,000
$825,000 +
–
$60,000
=
=Free Cash Flow Net Cash Flows from Operating Activities – Dividends –
Purchases of Plant Assets + Sales of Plant Assets
$750,000
=
= $60,000
34.3%
= 22.8%
573
$66,000
$28,000
( 22,000)
10,000 16,000
$82,000
Changes in current assets and current liabilities
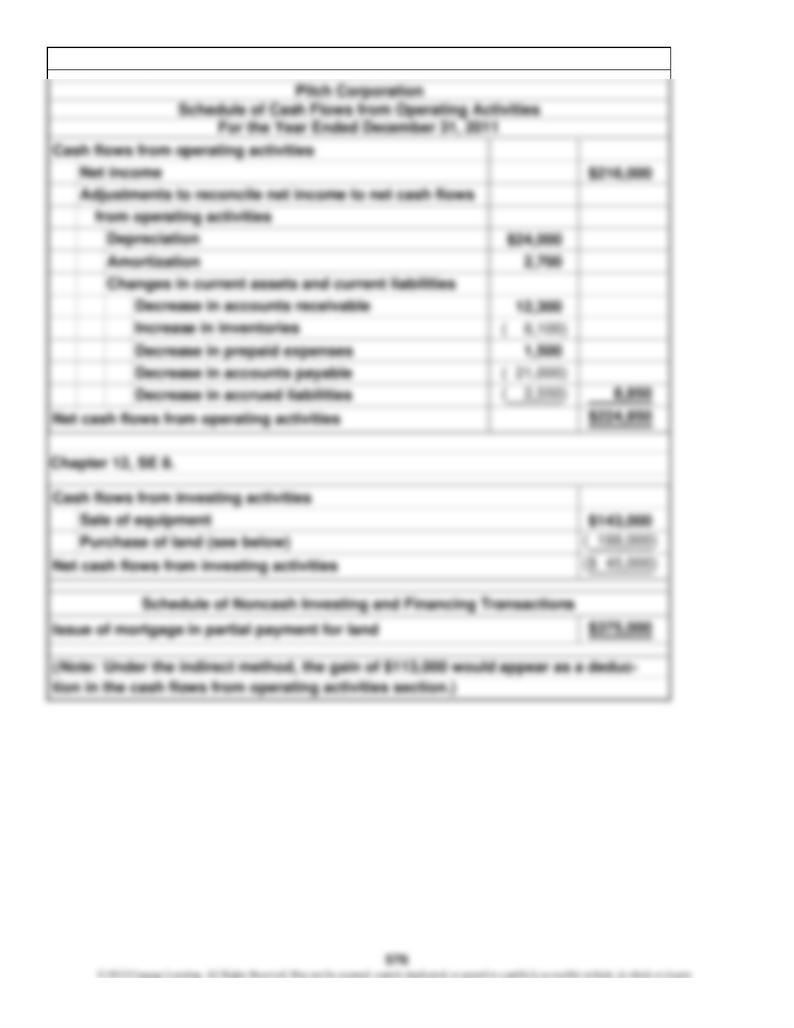
flows from operating activities
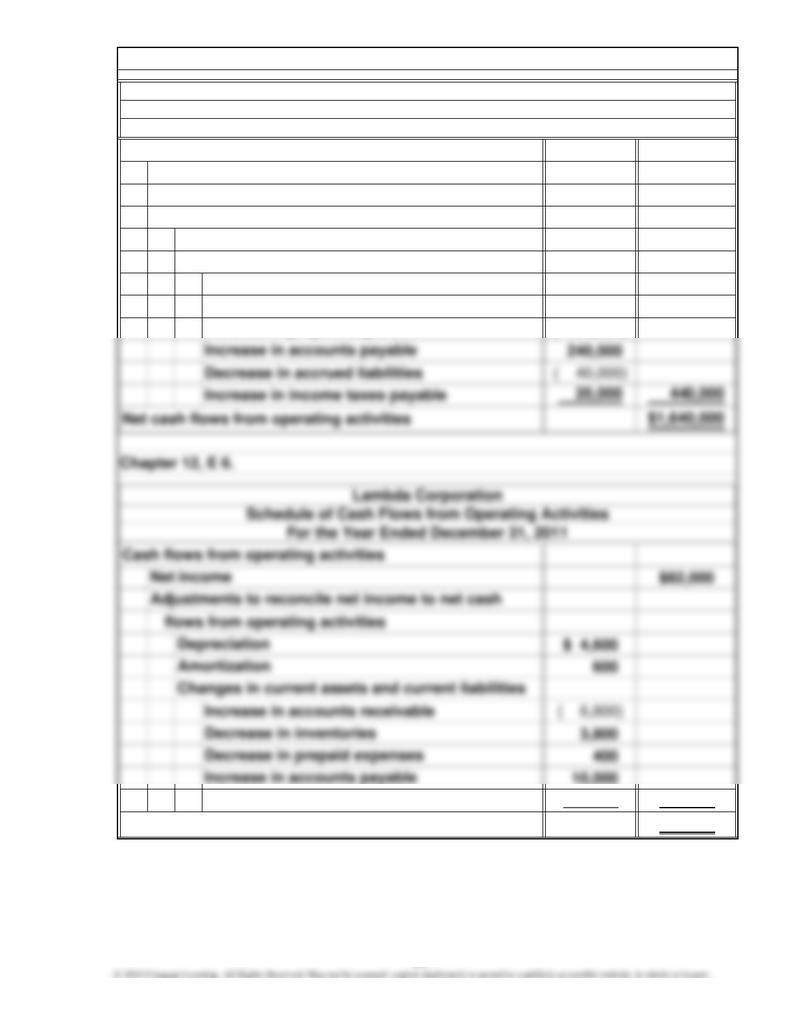
Increase in accounts receivable
Net cash flows from operating activities
Increase in accounts payable
Depreciation
Adjustments to reconcile net income to net cash
to improving all three efficiency ratios is better management of inventory, ac-
Cash flows from operating activities
Net income
erations. Free cash flow is positive, which indicates that the company was able
For the Year Ended December 31, 2011
Chapter 12, SE 5.
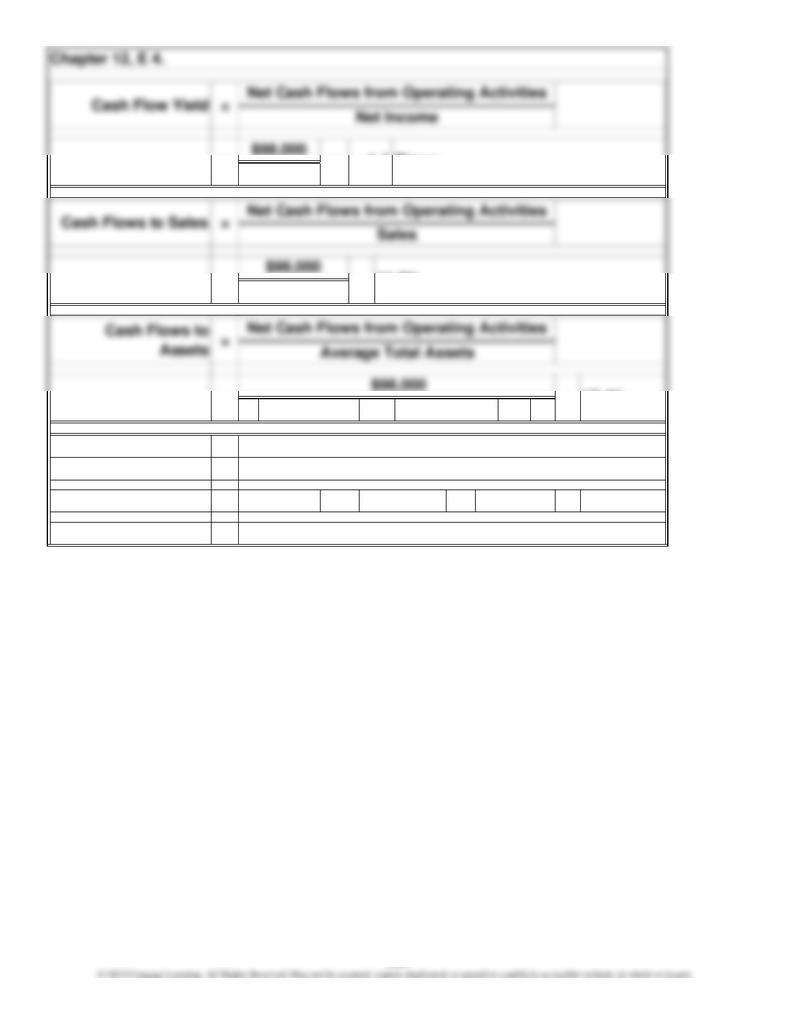
Chapter 12, SE 4.
$50,000 decrease in accounts payable. The cash flows to assets is slightly larger
than cash flows to sales because the asset turnover is slightly more than 1. Be-
Titan Corporation experienced this unfavorable yield primarily because of a
are only 70 percent of earnings. A yield of less than 1 signals potential problems.
did reduce liabilities by approximately 25 percent. Overall, the company improved
The cash flow yield is 0.7 times, which indicates that cash flows from operations
preciable assets, as indicated by a decline in the gross amount of equipment, it
to finance its net expenditures for land and equipment from its cash flows from
operations after paying dividends. Although the company did not replace its de-
counts payable, and accounts receivable, all of which affect cash flows from op-
its liquidity and its ability to borrow for possible future expansion.
Schedule of Cash Flows from Operating Activities
Express Corporation
cause cash flow yield is less than 1, we know that profit margin and return on
assets are higher than the cash flows to sales and cash flows to assets. The key
574
$144,000
$16,000
1,800
8,200
( 5,400)
1,000
( 14,000)
( 1,700) 5,900
$149,900
Increase in inventories
Decrease in prepaid expenses
Decrease in accrued liabilities
Net cash flows from operating activities
Decrease in accounts payable
Adjustments to reconcile net income to net cash flows
from operating activities
Schedule of Cash Flows from Operating Activities
For the Year Ended December 31, 2011
Cash flows from operating activities
Net income
Minh Corporation
Chapter 12, SE 6.
Depreciation
Amortization
Changes in current assets and current liabilities
Decrease in accounts receivable
575
Chapter 12, SE 7.
Chapter 12, SE 9.
4. 8.
a
b
Chapter 12, SE 11.
1.
2.
3.
1.
3.
5. b and a 10. d
c
and return on assets, respectively, because a cash flow yield of less than 1.0
from the comparative balance sheets. What is important from the statement of
Chapter 12, E 1.
579
) ÷ 2
=
=–+
=
=$525,000$600,000
+
=
=
$825,000
17.4%
=
11.9%
(
1.4 Times
$70,000
$98,000 $125,000 $23,000
($34,000)
Free Cash Flow
$30,000–
Net Cash Flows from Operating Activities – Dividends –
Purchases of Plant Assets + Sales of Plant Assets
580
$1,200,000
$820,000
( 700,000)
180,000
( 80,000)
( 900) 11,700
$93,700
Net cash flows from operating activities
Cash flows from operating activities
Net income
Adjustments to reconcile net income to net cash
Depreciation
Changes in current assets and current liabilities
Increase in accounts receivable
flows from operating activities
Decrease in inventory
Increase in prepaid expenses
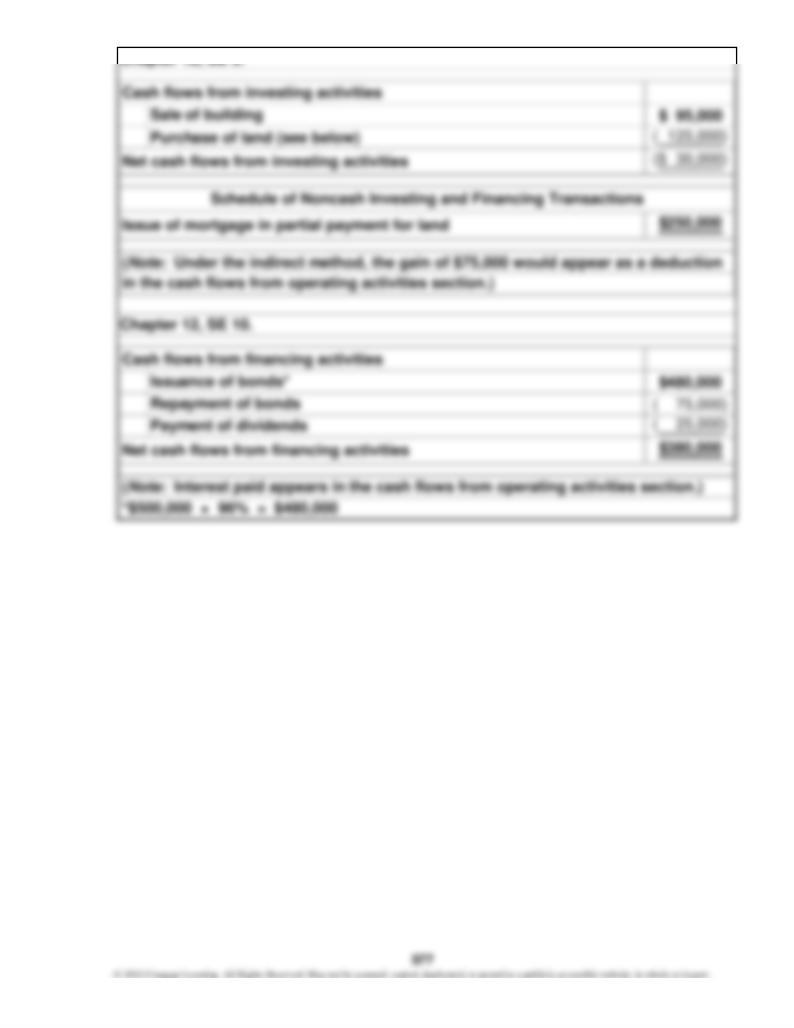
Chapter 12, E 5.
Schedule of Cash Flows from Operating Activities
For the Year Ended December 31, 2011
Decrease in accrued liabilities
Sunderland Chemical Company
581
$14,800
$ 4,000
( 8,800)
( 14,000)
2,800
28,000
2,000
( 1,200) 12,800
$27,600
($116,000)
65,000
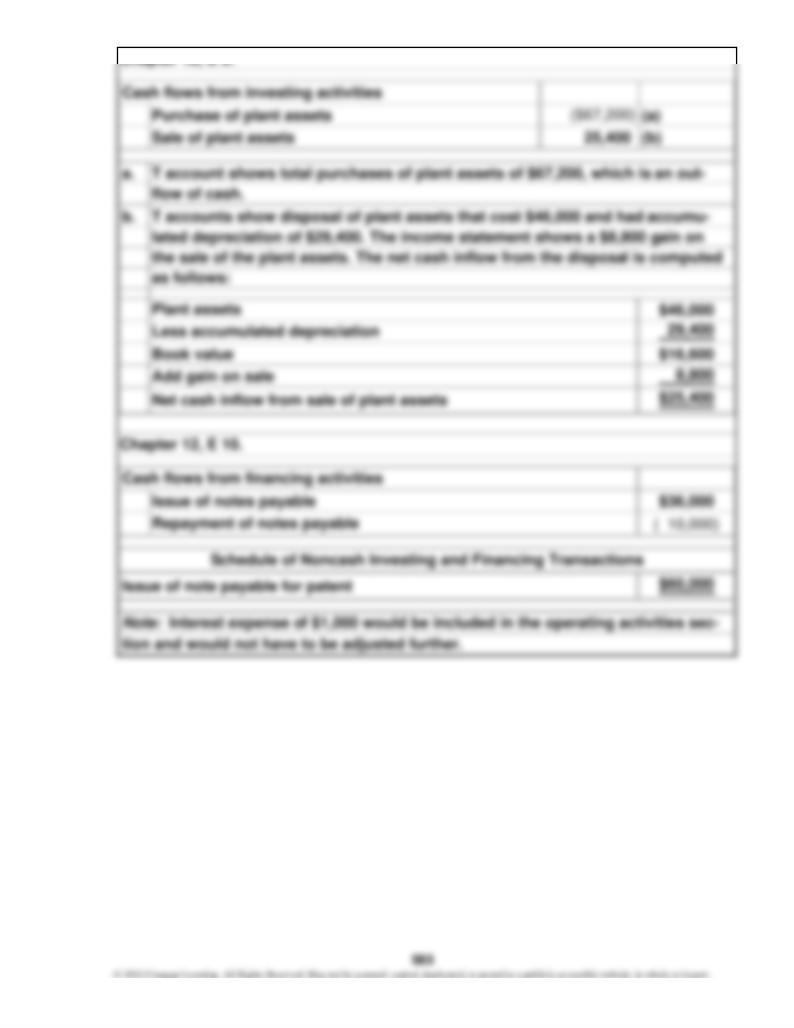
a.
b.
$78,000
13,000
$65,000
Increase in accounts receivable
(b)
(a)
Changes in current assets and current liabilities
Cash flows from operating activities
For the Year Ended June 30, 2011
Decrease in prepaid rent
Decrease in income taxes payable
Depreciation
Net cash flows from operating activities
Chapter 12, E 7.
Schedule of Cash Flows from Operating Activities
Freed Corporation
Net income
Adjustments to reconcile net income to net cash flows
from operating activities
Increase in inventories
Increase in salaries payable
Increase in accounts payable
Book value of investment sold
Chapter 12, E 8.
of cash.
T account shows $78,000 of investments sold. There was a $13,000 loss on the
T account shows purchases of investments to be $116,000, which is an outflow
Less loss on sale
Net cash inflow from sale
sale. The net cash flow from the sale is computed as follows:
Purchase of investments
Cash flows from investing activities
Sale of investments
582
Chapter 12, E 9.
( 600) 27,100
$45,000
11,700
($20,000)
25,000
( 4,300) 700
Chapter 12, E 11.
Net cash flows from operating activities
Decrease in income taxes payable
Sale of furniture*
Cash flows from investing activities
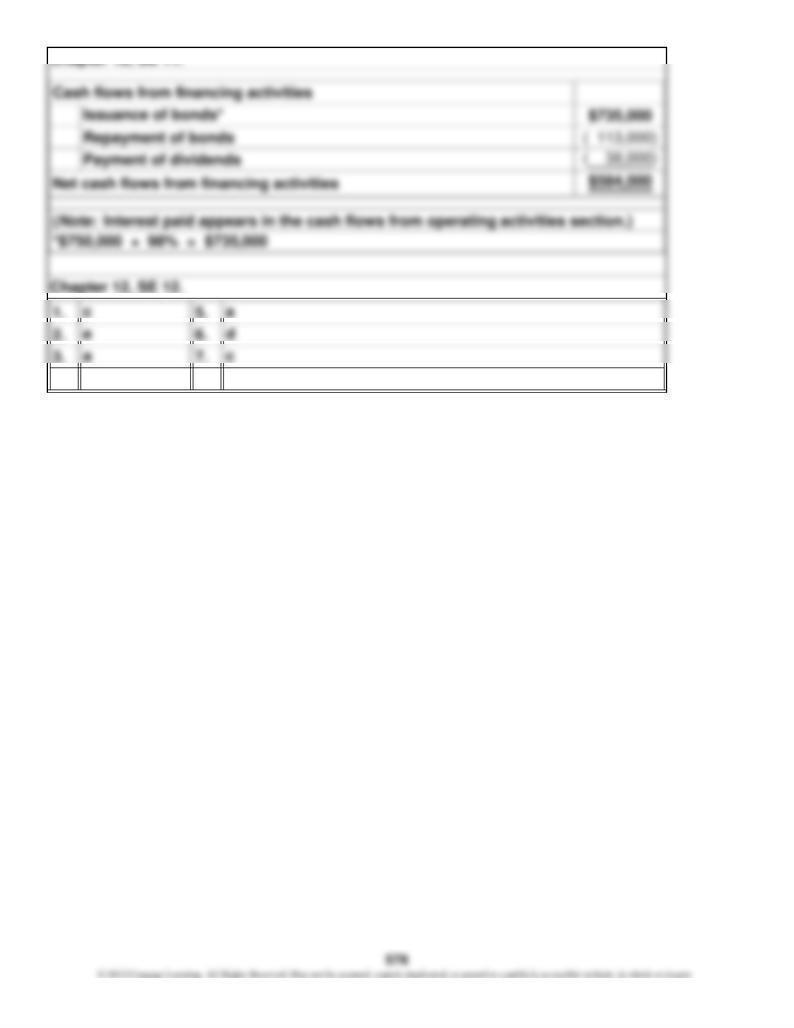
Cash flows from financing activities
Repayment of notes payable
Issue of common stock
Payment of dividends
Net cash flows from financing activities
585
1.
2.
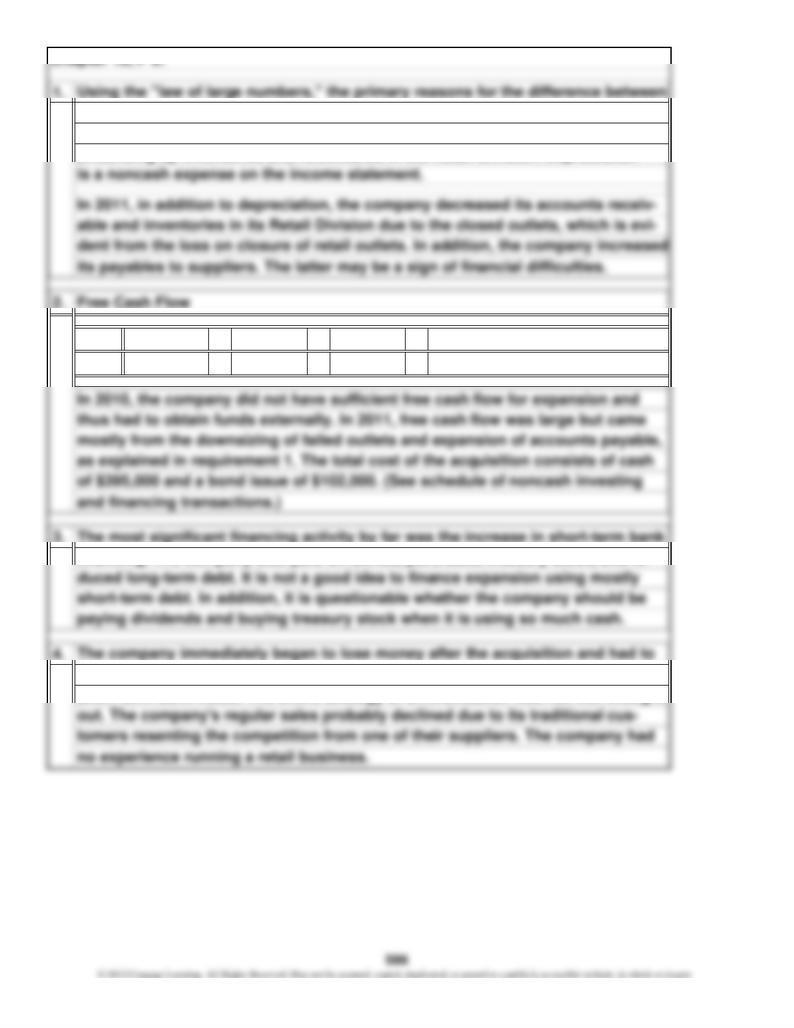
2010: ($ 71,446) – $39,640 – $60,890 =
2011: $364,300 – $45,400 – $31,200 =
3.
4.
Chapter 12, P 2.
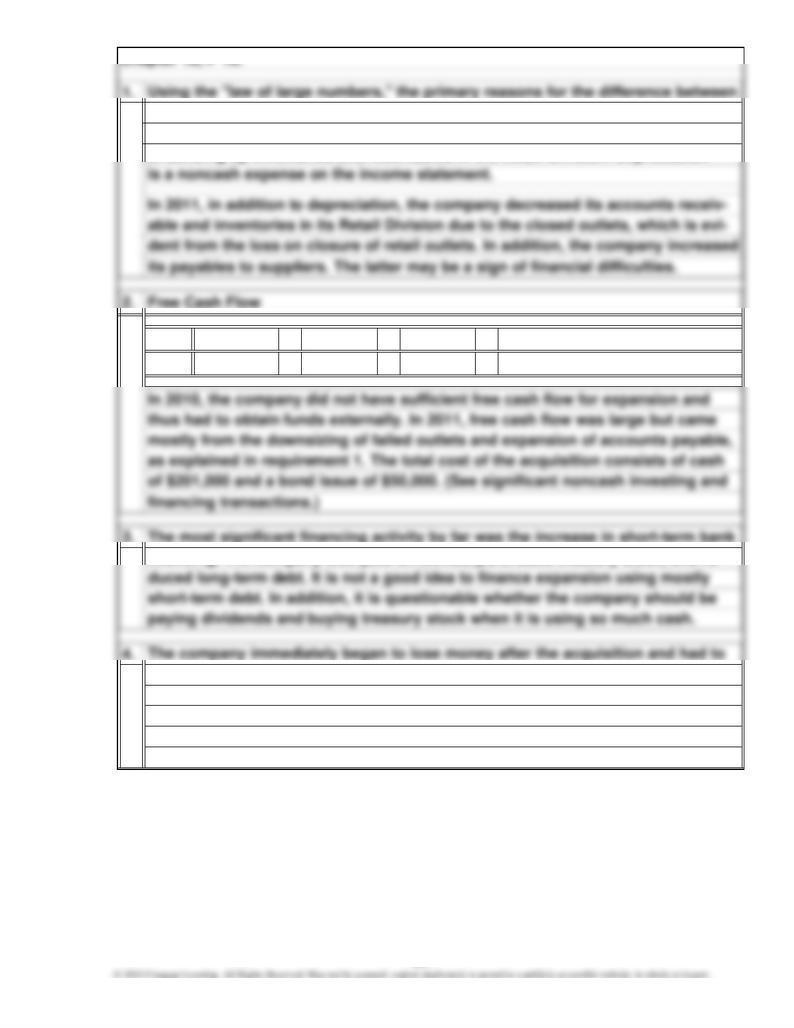
net income and cash flows from operating activities in 2010 are depreciation
and increases in inventory and accounts receivable. The last two are the result
close outlets to reduce inventory and receivables to raise cash to pay off the
financing. The company also paid dividends, purchased treasury stock, and re-
of building up inventories and receivables in the Retail Division. Depreciation
($171,976)
$287,700
short-term bank notes. The entire strategy of diversification was not well thought
$ 59,800
$30,000
2,000
10,000
20,000
200
11,000
4,000 77,200
$137,000
1,500
($10,000)
( 40,000)
from operating activities
Cash flows from operating activities
Net income
Adjustments to reconcile net income to net cash flows
Repayment of notes payable
Depreciation
Loss on sale of equipment
Changes in current assets and current liabilities
Increase in accounts payable
Net cash flows from operating activities
Cash flows from investing activities
Sale of equipment*
Cash flows from financing activities
Repayment of mortgage
Decrease in accounts receivable
Decrease in inventory
Decrease in prepaid expenses
1.
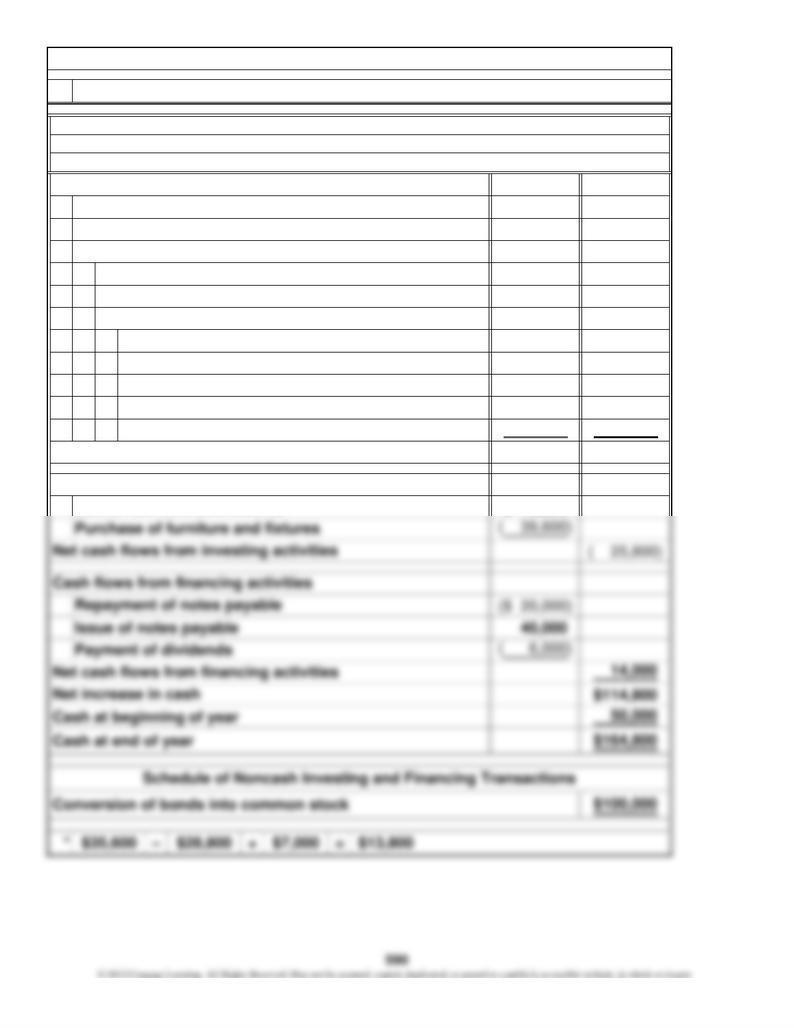
Chapter 12, P 3.
Statement of cash flows prepared
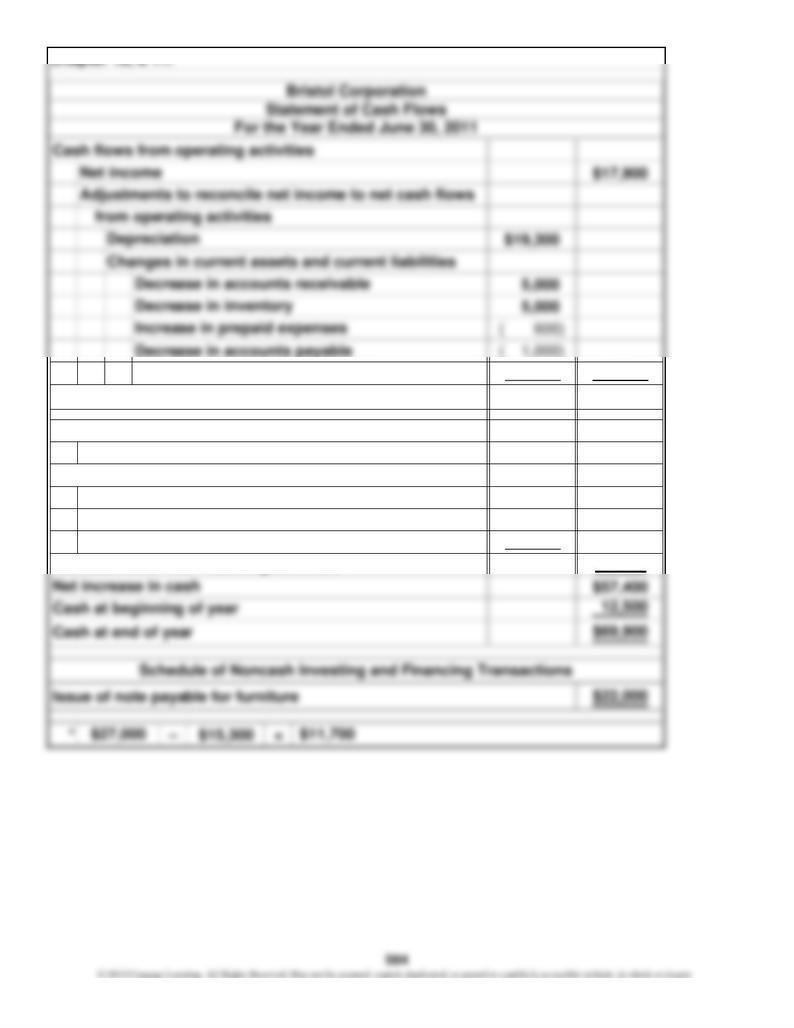
Bronek Corporation
For the Year Ended June 30, 2011
Statement of Cash Flows
Increase in income taxes payable
Chapter 12, P 3. (Continued)
$59,800
=
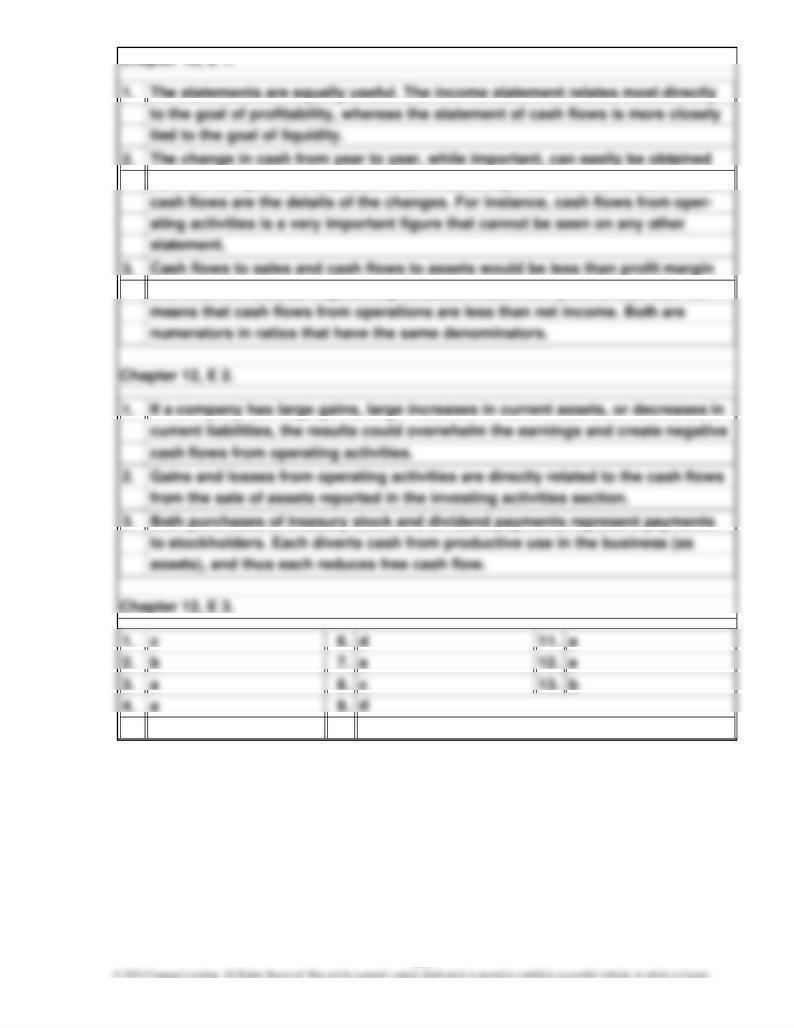
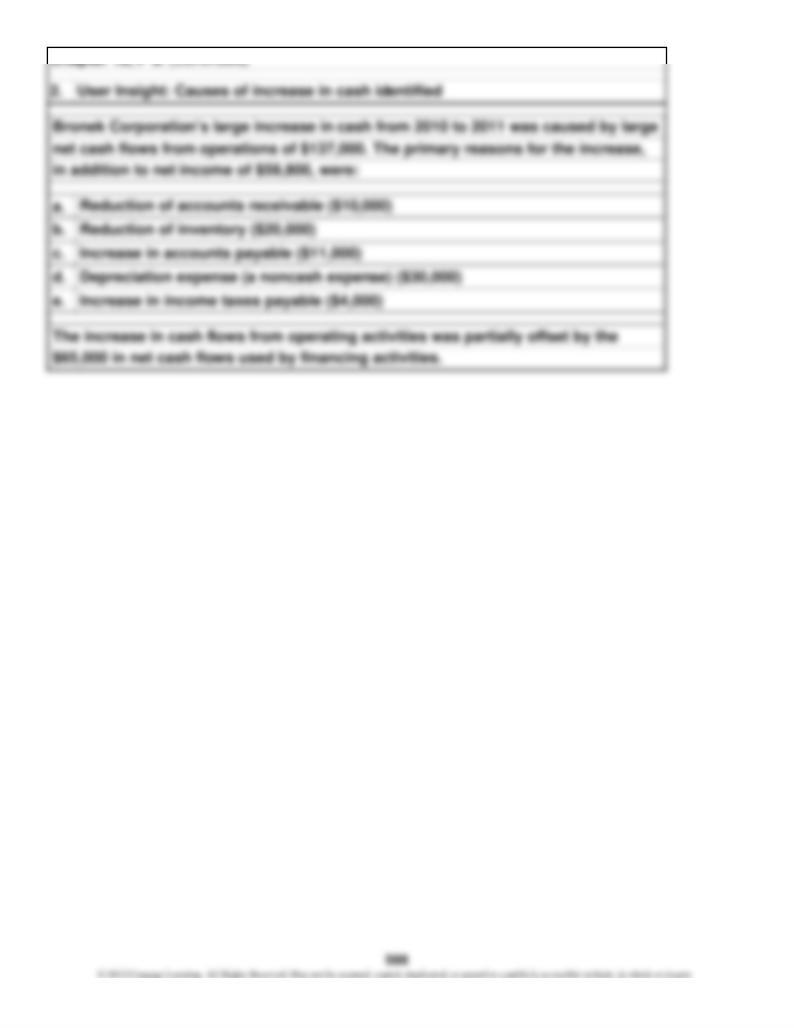
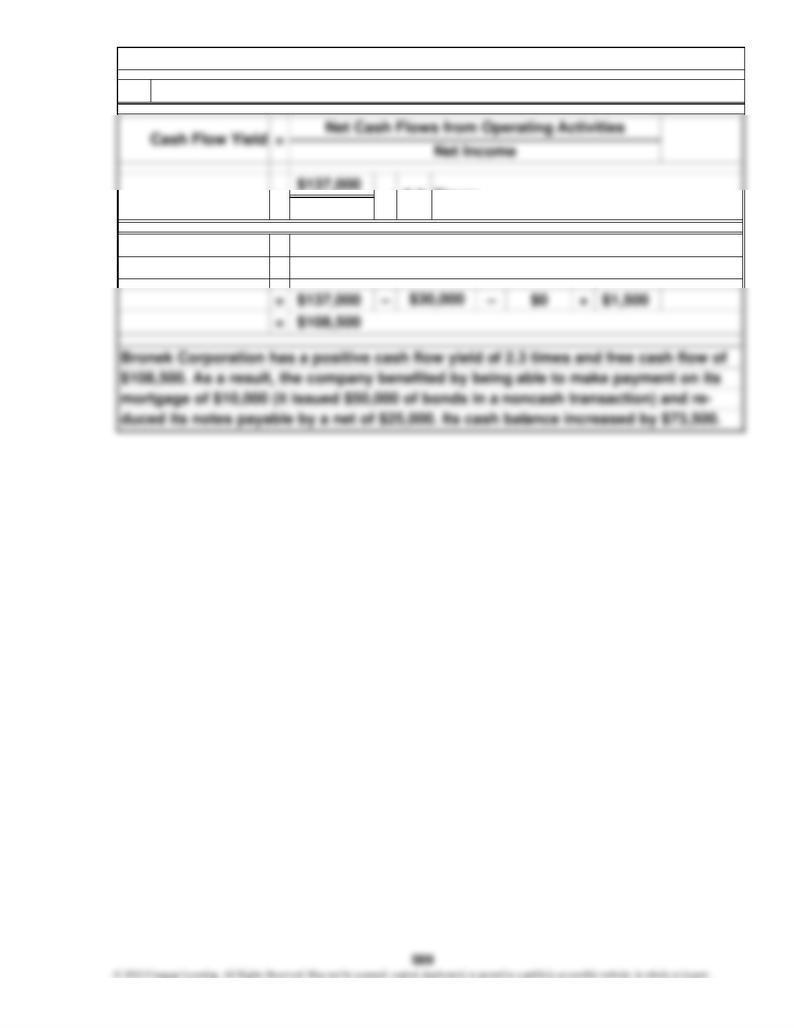
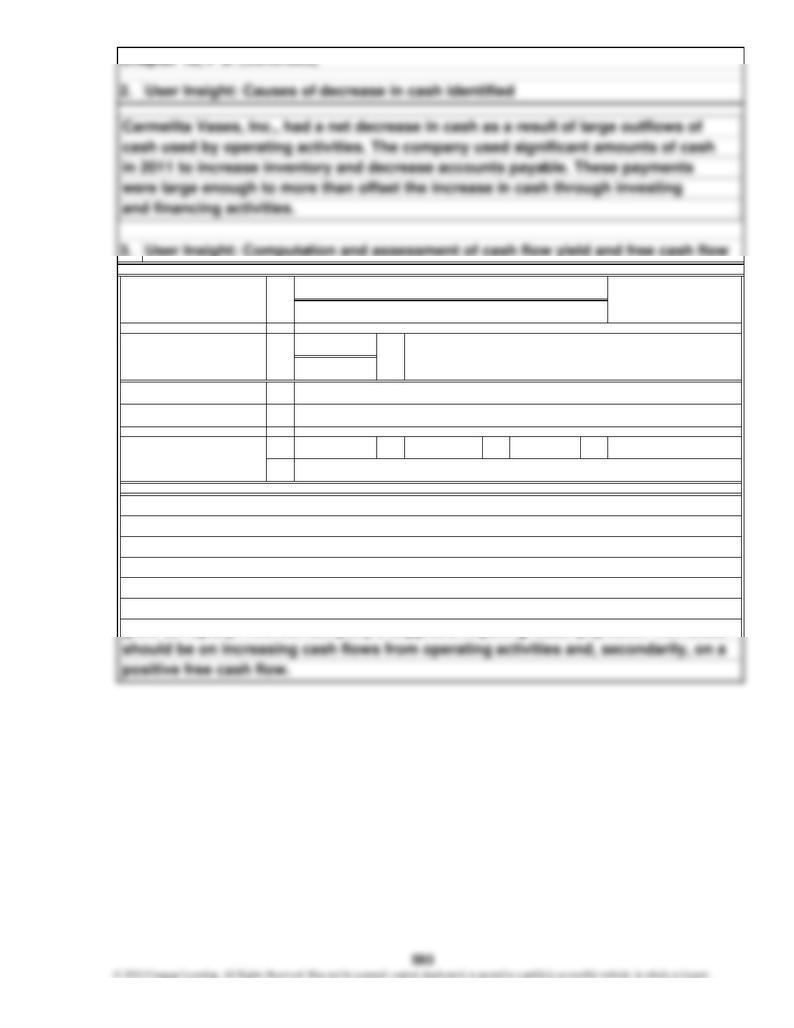
3. User Insight: Computation and assessment of cash flow yield and free cash flow
= 2.3
Times
Free Cash Flow
Chapter 12, P 3. (Continued)
Net Cash Flows from Operating Activities – Dividends –
Purchases of Plant Assets + Sales of Plant Assets
=
$ 11,000
$ 46,800
( 7,000)
34,800
100,000
1,000
( 57,000)
( 3,000) 115,600
$126,600
$ 13,800
Cash flows from investing activities
1. Statement of cash flows prepared
Depreciation
Gain on sale of furniture and fixtures
Changes in current assets and current liabilities
Decrease in merchandise inventory
Decrease in prepaid rent
Net cash flows from operating activities
Decrease in accounts receivable
Decrease in accounts payable
Decrease in income taxes payable
Cash flows from operating activities
Net income
Adjustments to reconcile net income to net cash flows
from operating activities
Sale of furniture and fixtures*
Brick Corporation
Chapter 12, P 4.
Statement of Cash Flows
For the Year Ended December 31, 2011

$11,000
=
Chapter 12, P 4. (Continued)
Free Cash Flow
Times
3. User Insight: Computation and assessment of cash flow yield and free cash flow
11.5
2011
Net Cash Flows from Operating Activities – Dividends –
==
Purchases of Plant Assets + Sales of Plant Assets
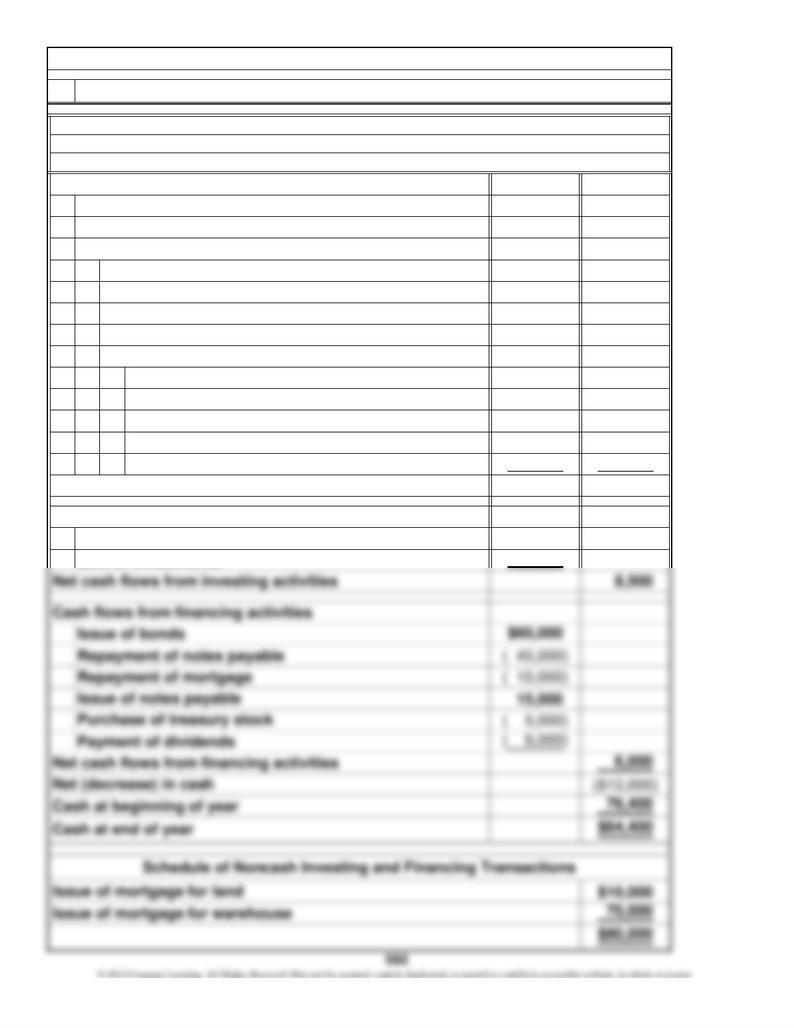
$24,000
$20,000
15,000
5,000
( 8,500)
5,000
( 40,000)
3,000
( 47,500)
( 2,500) ( 50,500)
($26,500)
($29,000)
37,500 8,500
Cash flows from operating activities
Carmelita Vases, Inc.
Chapter 12, P 5.
Statement of Cash Flows
1. Statement of cash flows prepared
Decrease in accounts payable
Decrease in accrued liabilities
Purchase of investments
Depreciation—building
Decrease in accounts receivable
Net income
Adjustments to reconcile net income to net cash flows
Depreciation—equipment
Amortization—intangibles
from operating activities
Increase in inventory
Gain on sale of investments
Changes in current assets and current liabilities
For the Year Ended December 31, 2011
Cash flows from investing activities
Sale of investments
Decrease in prepaid expenses
Net cash flows from operating activities
($26,500)
$24,000
=
=($26,500) – – $0 +
=
Net Income
= not meaningful
3.
Purchases of Plant Assets + Sales of Plant Assets
Net Cash Flows from Operating Activities – Dividends –
$0
Net Cash Flows from Operating Activities
and issued bonds. Overall, the situation warrants investigation. Why did inventory
and pay accounts payable. Further, this contributed to the company's negative free
divided into negative cash flow. The major uses of cash were to increase inventory
negative. The cash flow yield was not meaningful because a positive net income is
grow so rapidly? Are the company's suppliers requiring faster payment? The focus
Despite a net income in 2011, Carmelita Vase's cash flows from operations were
cash flow of $35,500. To bolster its cash balance, the company sold investments
$9,000
($35,500)
=
Chapter 12, P 5. (Continued)
Cash Flow Yield =
Free Cash Flow
594
$ 28,000
$15,000
3,000
3,000
( 5,300)
( 27,000)
25,000
20,000
( 26,000)
( 12,300) ( 4,600)
$ 23,400
($12,500)
6,300
Cash flows from operating activities
Net income
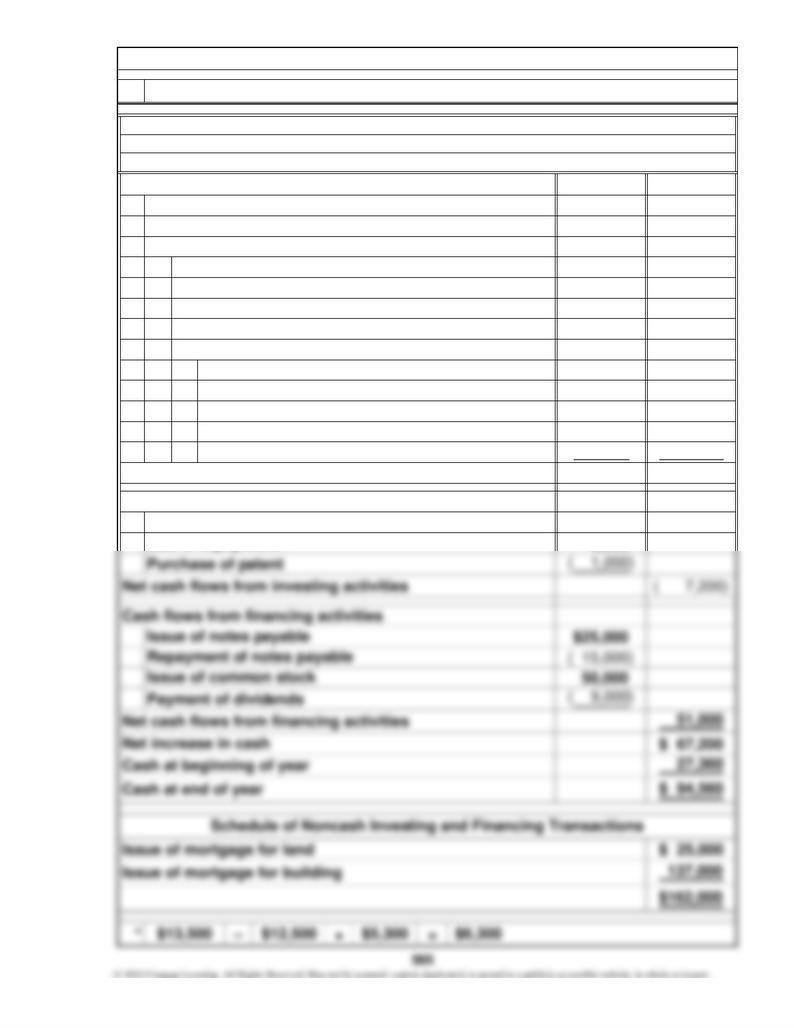
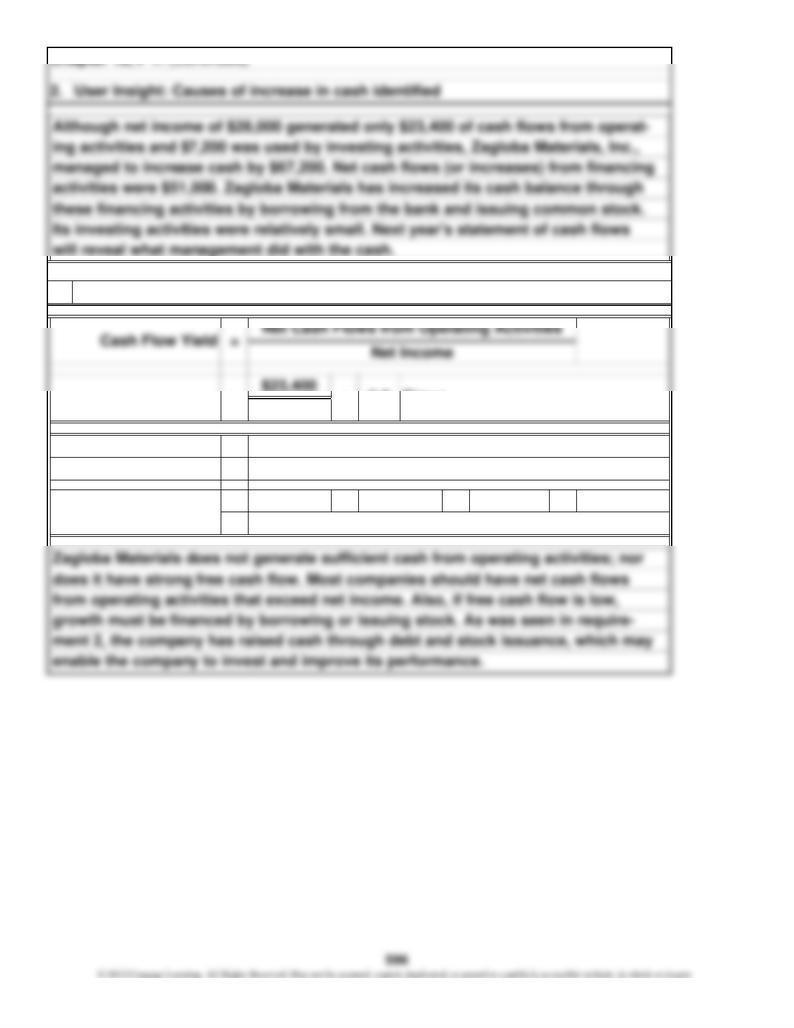
Zagloba Materials, Inc.
Chapter 12, P 7.
Statement of Cash Flows
For the Year Ended December 31, 2011
Depreciation—building
Gain on sale of equipment
Changes in current assets and current liabilities
Increase in accounts receivable
Decrease in inventory
Sale of equipment*
Decrease in accounts payable
Decrease in accrued liabilities
1. Statement of cash flows prepared
Adjustments to reconcile net income to net cash flows
from operating activities
Purchase of equipment
Amortization—patent
Depreciation—equipment
Decrease in prepaid expenses
Net cash flows from operating activities
Cash flows from investing activities
$28,000
=
= $23,400 – – $12,500 + $6,300
=
$9,000
$8,200
Purchases of Plant Assets + Sales of Plant Assets
==
3. User Insight: Computation and assessment of cash flow yield and free cash flow
0.8 Times
Net Cash Flows from Operating Activities – Dividends –
Chapter 12, P 7. (Continued)
Free Cash Flow
$ 56,000
$ 30,000
6,000
6,000
( 10,600)
( 54,000)
50,000
40,000
( 52,000)
( 24,600) ( 9,200)
$ 46,800
($ 25,000)
12,600
Cash flows from investing activities
Purchase of equipment
Sale of equipment*
Cash flows from operating activities
Depreciation—building
Net cash flows from operating activities
Decrease in inventory
Amortization—patent
Depreciation—equipment
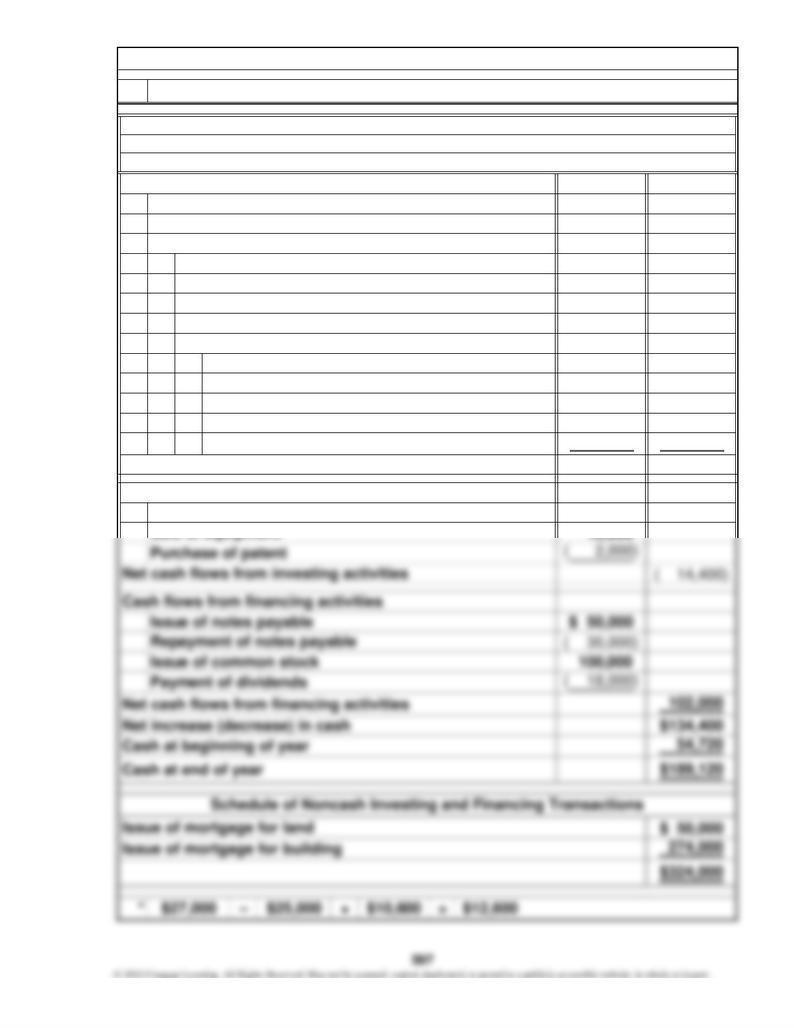
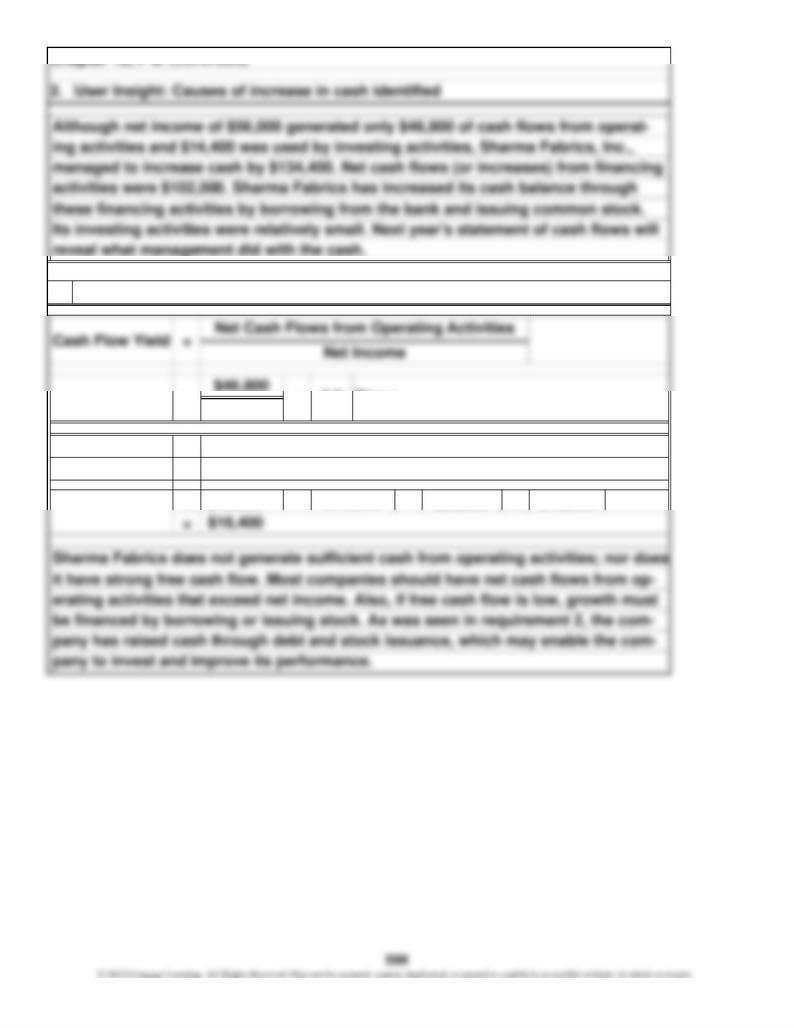
Sharma Fabrics, Inc.
Chapter 12, P 8.
1. Statement of cash flows prepared
For the Year Ended December 31, 2011
Decrease in accounts payable
Decrease in accrued liabilities
Net income
Adjustments to reconcile net income to net cash flows
from operating activities
Gain on sale of equipment
Changes in current assets and current liabilities
Increase in accounts receivable
Decrease in prepaid expenses
Statement of Cash Flows
$56,000
=
= $46,800 – – $25,000 + $12,600
Chapter 12, P 8. (Continued)
Free Cash Flow
Times=
3. User Insight: Computation and assessment of cash flow yield and free cash flow
Net Cash Flows from Operating Activities – Dividends –
$18,000
Purchases of Plant Assets + Sales of Plant Assets
0.8
=
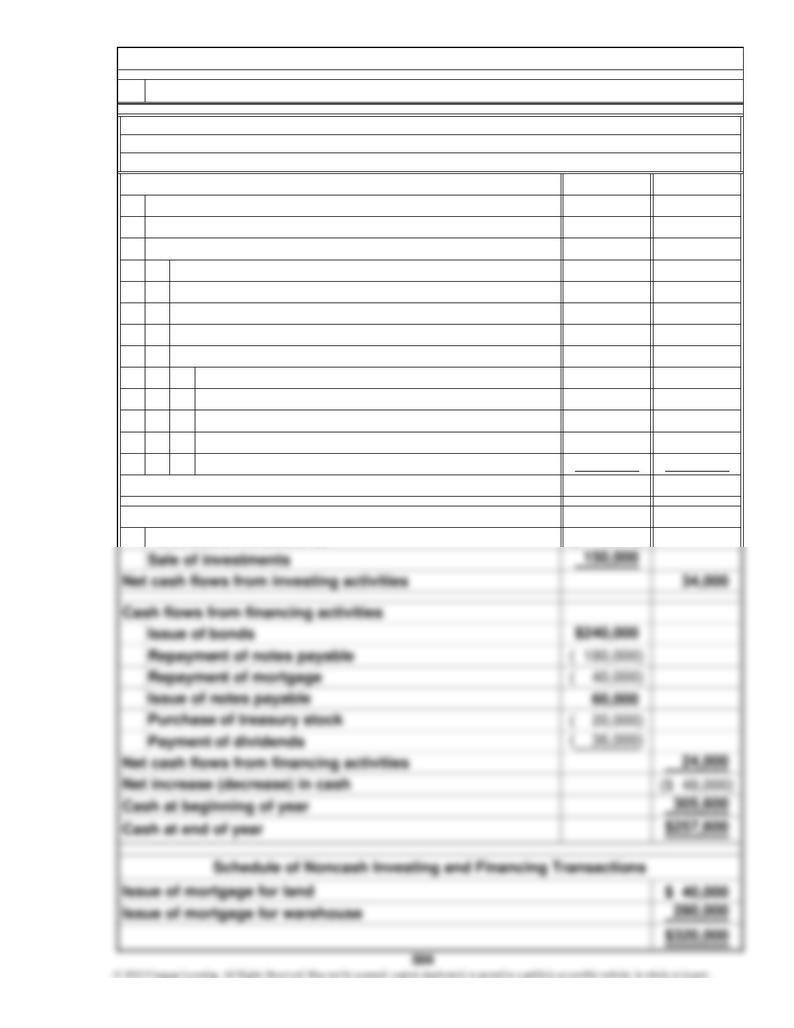
$ 96,000
$ 80,000
60,000
20,000
( 34,000)
20,000
( 160,000)
12,000
( 190,000)
( 10,000) ( 202,000)
($106,000)
($116,000)
Net cash flows from operating activities
Decrease in prepaid expenses
Net income
Adjustments to reconcile net income to net cash flows
Depreciation—building
Gain on sale of investments
Depreciation—equipment
Amortization—intangibles
Cash flows from investing activities
Purchase of investments
1. Statement of cash flows prepared
from operating activities
Cash flows from operating activities
Changes in current assets and current liabilities
Decrease in accounts receivable
Increase in inventory
Decrease in accounts payable
Decrease in accrued liabilities
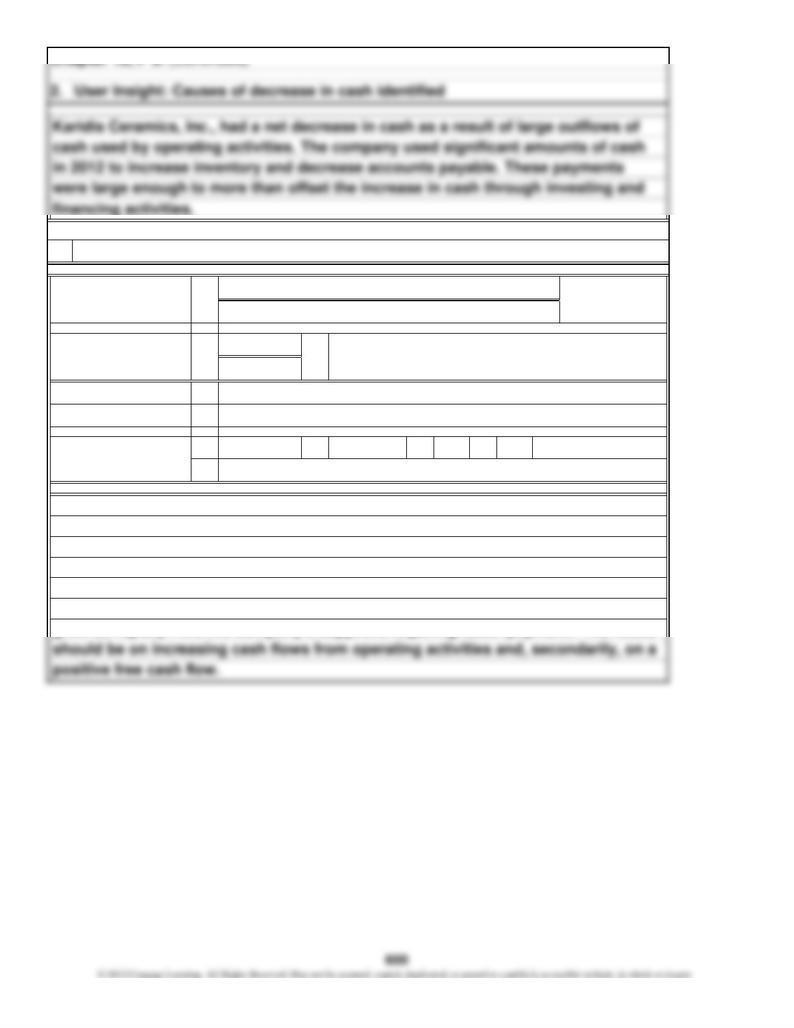
Karidis Ceramics, Inc.
Chapter 12, P 9.
Statement of Cash Flows
For the Year Ended December 31, 2012
($106,000)
$96,000
=
=($106,000) – – $0 + $0
=
Chapter 12, P 9. (Continued)
3.
User Insight: Computation and assessment of cash flow yield and free cash flow
not meaningful
Cash Flow Yield
and issued bonds. Overall, the situation warrants investigation. Why did inventory
and pay accounts payable. Further, this contributed to the company's negative free
divided into negative cash flow. The major uses of cash were to increase inventory
=
grow so rapidly? Are the company's suppliers requiring faster payment? The focus
Despite a net income in 2012, Karidis Ceramics' cash flows from operations were
cash flow of $142,000. To bolster its cash balance, the company sold investments
Net Cash Flows from Operating Activities – Dividends –
$36,000
($142,000)
negative. The cash flow yield was not meaningful because a positive net income is
Net Cash Flows from Operating Activities
Net Income
Purchases of Plant Assets + Sales of Plant Assets
==
Free Cash Flow
1.
2.
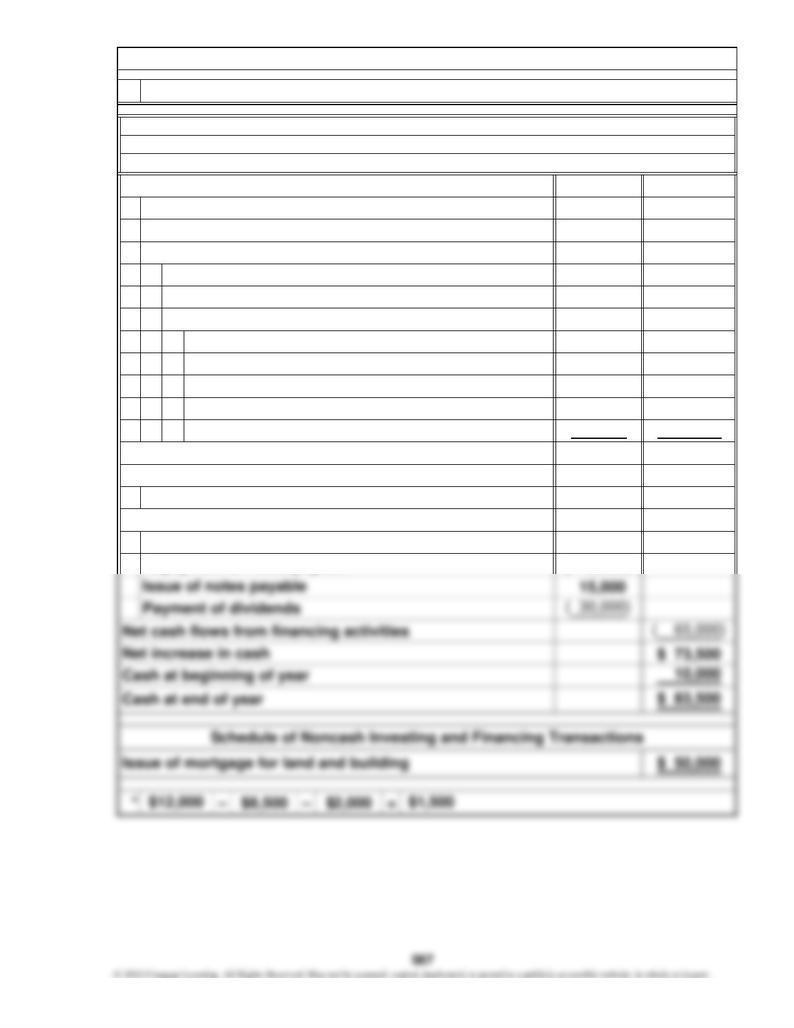
2010: ($ 38,472) – $19,973 – $33,112 =
2011: $184,227 – $22,924 – $16,145 =
3.
4.
net income and cash flows from operating activities in 2010 are depreciation
and increases in inventory and accounts receivable. The last two are the result
of building up inventories and receivables in the Retail Division. Depreciation
short-term bank notes. The entire strategy of diversification was not well thought
out. The company's regular sales probably declined due to its traditional cus-
tomers resenting the competition from one of their suppliers. The company had
no experience running a retail business.
close outlets to reduce inventory and receivables to raise cash to pay off the
$145,158
Chapter 12, P 10.
financing. The company also paid dividends, purchased treasury stock, and re-
($ 91,557)
601
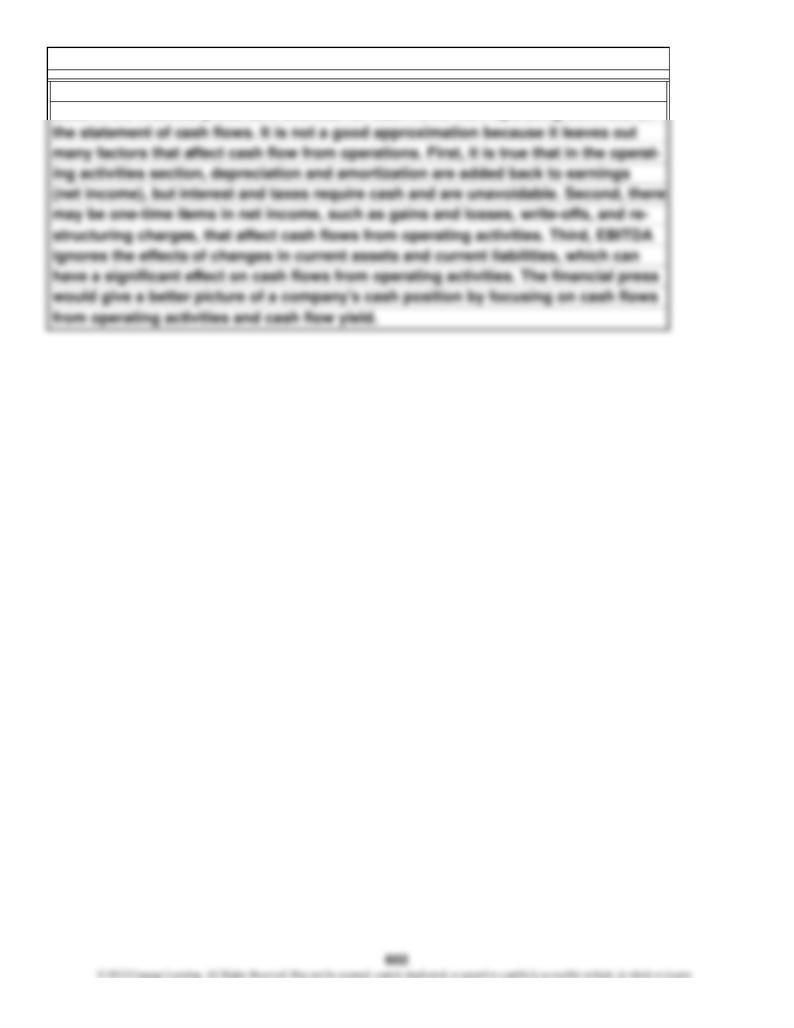
EBITDA (earnings before interest, taxes, depreciation, and amortization) is often
used in the financial press as a shortcut for cash flows from operating activities on
Chapter 12, C 1.
=
($753)
0.2%
1.
Chapter 12, C 2.
Make required computations and label the document "Attachment"
2000 =
Net Cash Flows from Operating Activities – Dividends –
Purchases of Plant Assets + Sales of Plant Assets
Free Cash Flow
$64,926
2001.
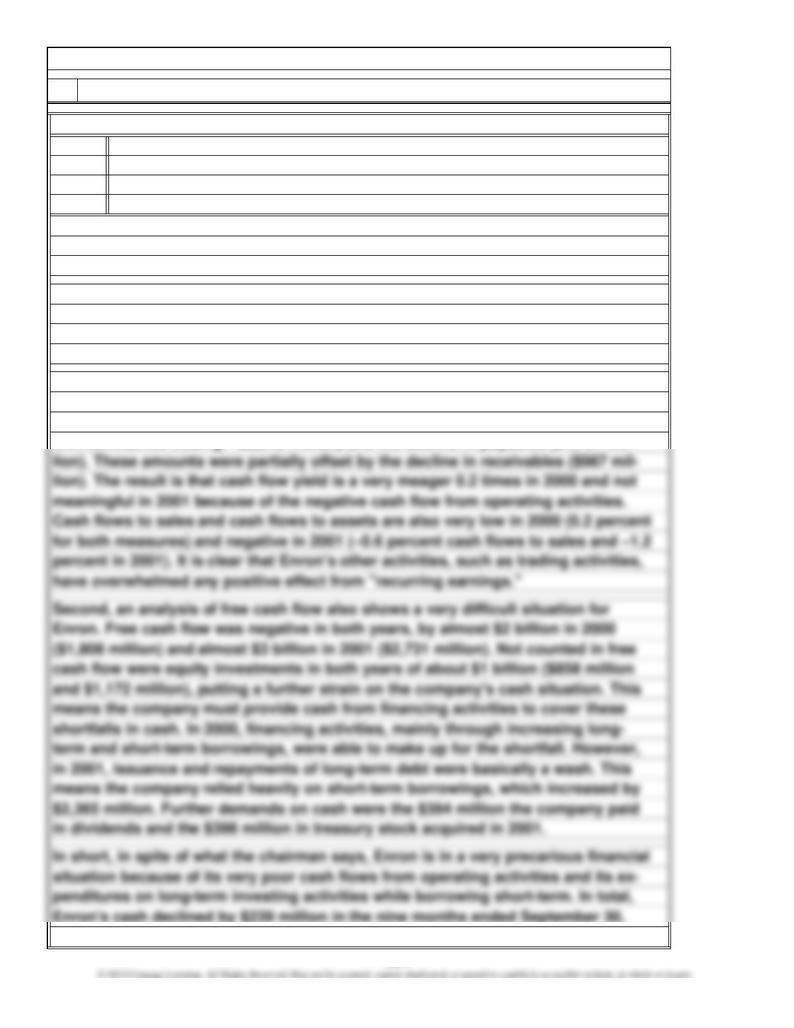
cash flows. Enron's statement of cash flows and the computation on which this
Re:
At your request, I have prepared an analysis of Enron Corporation's statement of
Today's Date
Investment Analyst
StudentFrom:
ferent story.
negative cash flows in 2001 were the net margin deposit activity (in connection
Chapter 12, C 2. (Continued)
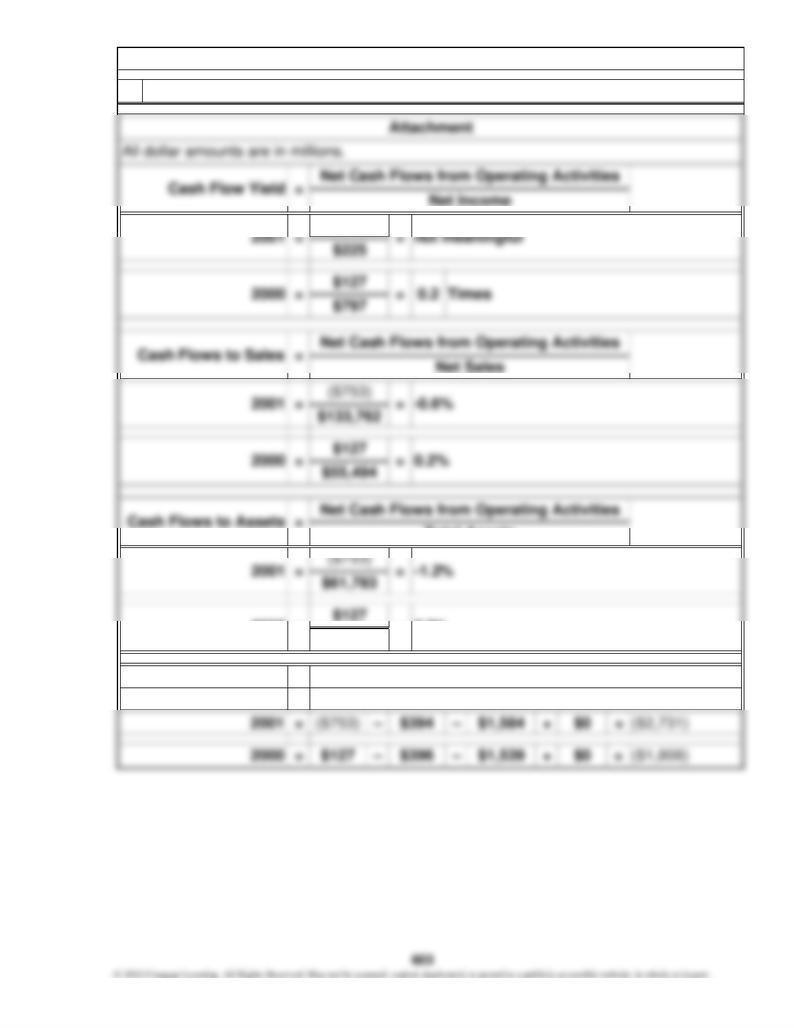
In fact, the net income, or "bottom line," decreased from $797 million in 2000 to $225
million in 2001 (nine-month period). Also, the statement of cash flows tells a very dif-
Memorandum
Date:
To:
Mr. Lay, Chairman of Enron, referred to a 26 percent increase in recurring earnings.
Assessment of Enron's Statements of Cash Flows
analysis is based are presented in attachments.
First, net cash provided by operating activities was only $127 million in 2000 and
declined to a negative $753 million in 2001. The largest items accounting for the
with derivatives trading—$2,349 million) and the decline in payables ($1,764 mil-
2. Prepare a memorandum to the investment analyst
604
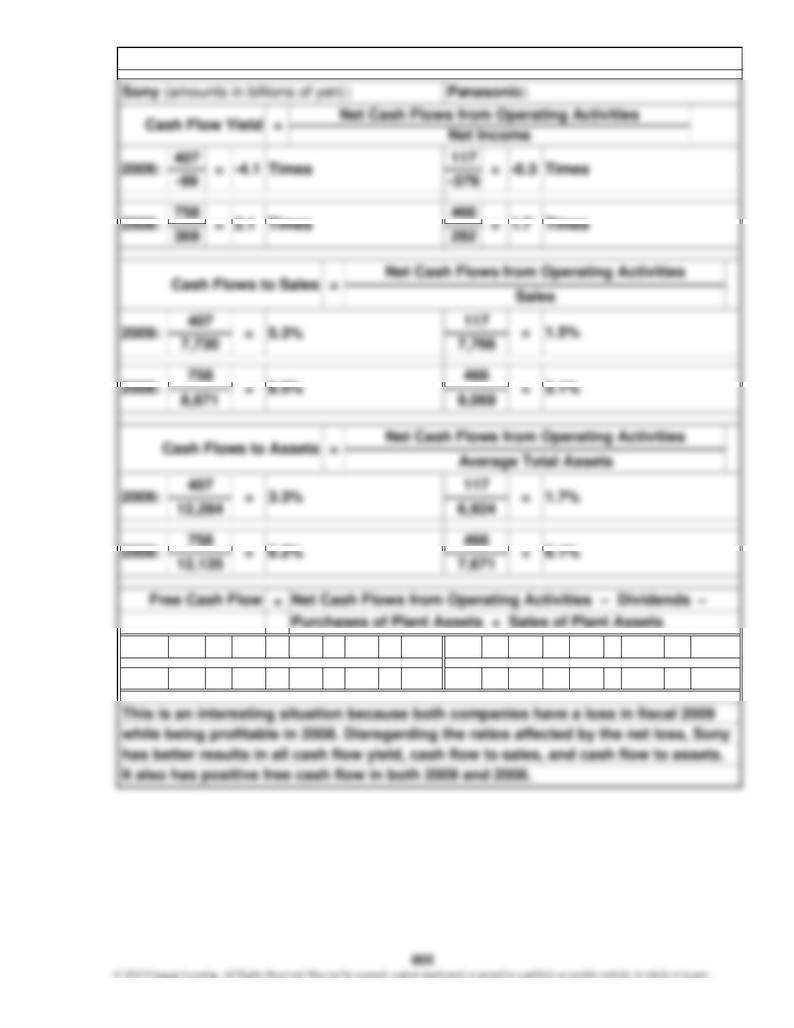
2009: 407 – 43 – 496 + 153 = 21 117 – 83 – 522 + 40 =
2008: 758 – 25 – 475 + 145 = 403 466 – 69 – 419 + 151 =
Chapter 12, C 3.
129
(448)
$120,000
$20,000
( 32,000)
( 60,000)
Increase in accounts receivable
Statement of Cash Flows
For the Year Ended December 31, 2011
Changes in current assets and current liabilities
Adjustments to reconcile net income to net cash
Net income
Chapter 12, C 4.
1. Statement of cash flows prepared
Increase in inventory
Roll Print Gallery, Inc.
Cash flows from operating activities
flows from operating activities
Depreciation
2. Cash problem explained
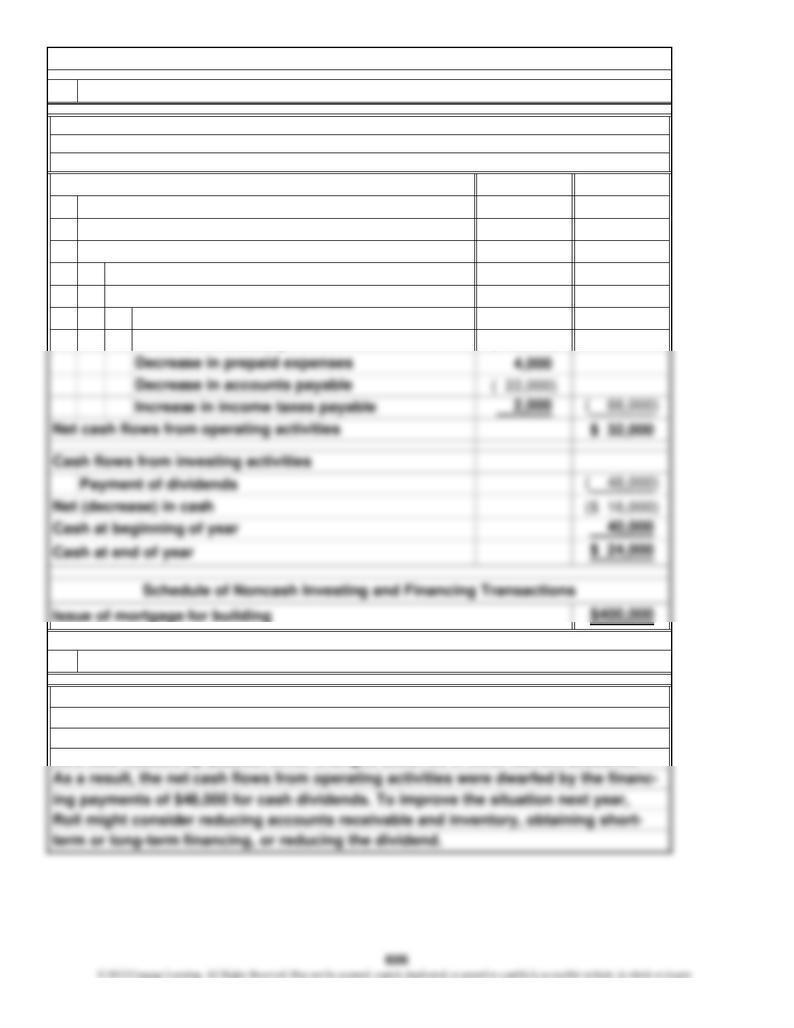
Although Roll earned $120,000 and had $20,000 of depreciation during the year,
operating activities generated only $32,000 in cash because of the large increases
in accounts receivable ($32,000) and inventory ($60,000). In addition, accounts pay-
able was reduced by $22,000. Minor changes occurred in other current accounts.
1.
2.
3.
Chapter 12, C 5.
bottom of the statement. This reconciliation uses the indirect method and should
be used to understand CVS's cash flows from operations. The most important
items affecting cash flows from operations other than net earnings are depreci-
ties. In order to understand the difference between net income and net cash pro-
vided by operating activities, it is necessary to look at the reconciliation at the
used in 2009.
billion in the last two years. The other large item was the repurchase of common
total. In addition, acquisitions and other investments totaled more than $2.7 bil-
totaled only $0.7 billion. Also, the increase in short-term debt totaled over $3.7
creased by a total of $4.1 billion from $0.9 billion provided in 2008 to $3.2 billion
stock of $2.5 billion in 2009. Overall, net cash used in financing activities in-
the company had additions to long-term debt of $3.2 billion, while reductions
pany has had additions to property and equipment that exceeded $4.7 billion in
607
( + ) ÷ 2
=
Chapter 12, C 6.
(dollars in millions)
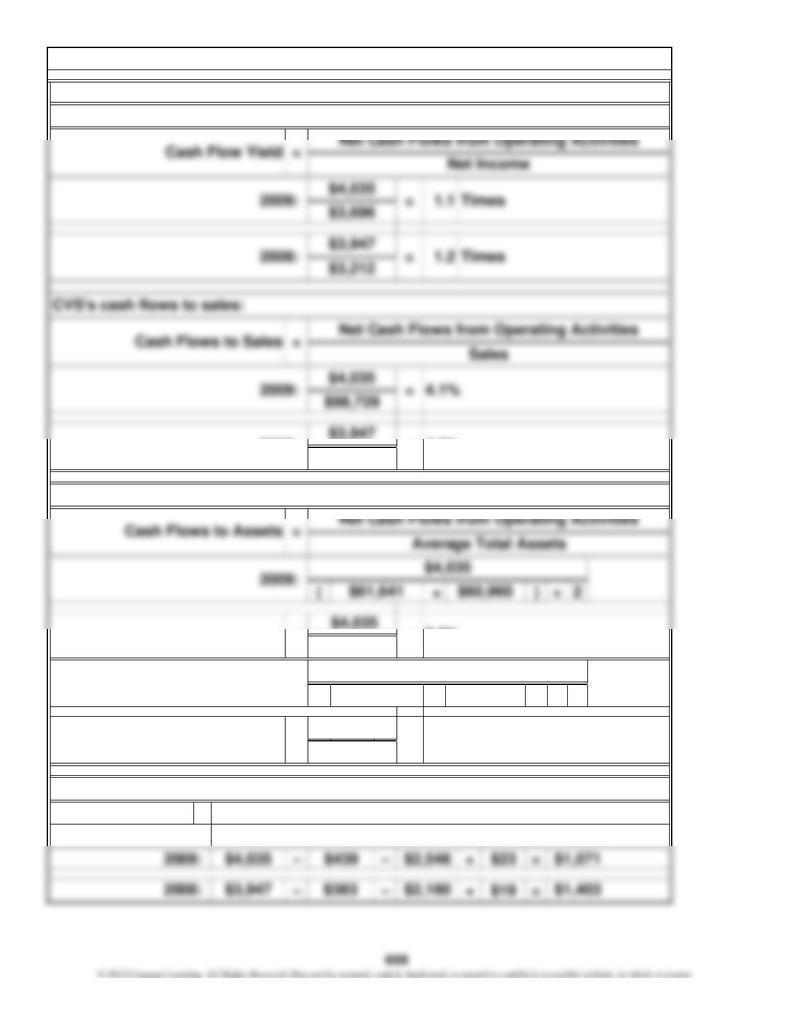
CVS's cash flow yield:
$87,472
2008: =
6.6%
CVS's cash flows to assets:
4.5%
=
=
$3,947
=
– Purchases of Plant Assets + Sales of Plant Assets
=
CVS's free cash flow:
$61,301
Free Cash Flow
Net Cash Flows from Operating Activities – Dividends
$3,947
$57,841 6.8%
$60,960 $54,722
2008:
=
––+=
––+=
$923
Net Cash Flows from Operating Activities – Dividends
2008: ($2,457)
$387
$13
2009: $985 $13 $585
$0($1,521)
=
$0
Free Cash Flow
– Purchases of Plant Assets + Sales of Plant Assets
= -9.9%
7.0%
$15,420
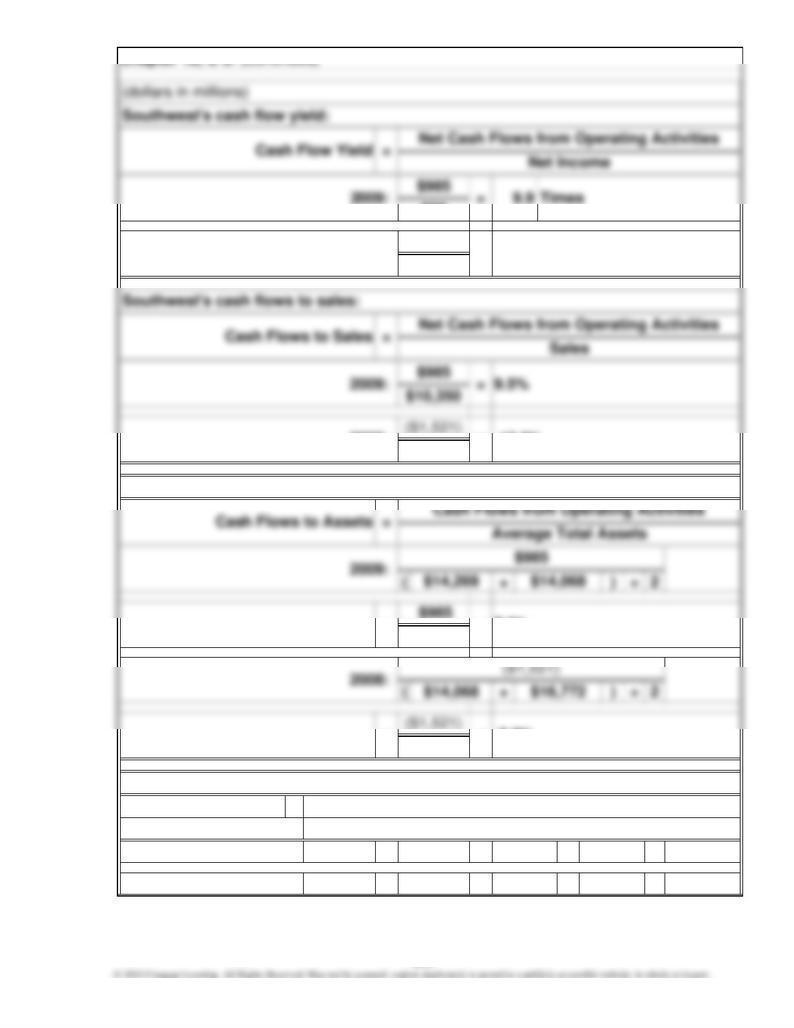
Southwest's free cash flow:
not meaningful
Southwest's cash flows to assets:
=
$11,023
2008: =
($1,521)
$178
$99 9.9 Times
Chapter 12, C 6. (Continued)
2008:
-13.8%
=
= $14,169
609
Chapter 12, C 6. (Continued)
flows.
the note is for only two years and is "close" to being a current liability. Allowances
years in relation to asset growth. The company will need to continue borrowing to
times in 2009, but the cash flow yield for 2008 is not meaningful due to negative
CVS's cash flow yield exceeds 1.0 times but is not sufficient to generate high cash
flows to sales or to assets. In addition, free cash flow was relatively low in both
high depreciation. Therefore, for 2009, Southwest has higher cash flows to sales
finance expansion. Southwest, on the other hand, had a high cash flow yield of 9.9
cash flow from operating activities, partly caused by low net income in relation to
and to assets than CVS does. These ratios are not meaningful and/or negative for
Southwest's 2008 operations. CVS had greater free cash flows in both years. Both
companies have decreased their cash balances during the year. Due to the nega-
tive ratios for Southwest in 2008, overall, it appears that CVS has stronger cash
for judgment would permit the reclassification. Also, the 3.0 ratio requirement is
Students will disagree on this case. Some will think the president's order is tanta-
mount to lying. Others will see it as the practical thing to do, especially given that
Chapter 12, C 7.
quite arbitrary. Why risk a serious situation over such a small thing? Most will argue