Chapter 17 - The Management and Control of Quality
Chapter 17
The Management and Control of Quality
Learning Objectives
8. Describe lean manufacturing and changes in management accounting systems to support a change
to “lean”
New in this Edition
• Two new end-of-chapter problems and three updated/revised end-of-chapter problems
• Expanded discussion of “net promoter score” as a non-financial performance indicator
• One updated Real-World-Focus (RWF) items plus eight totally new RWF items, covering the
following topics: Creating a Culture of Quality; Lowering Health Care Costs & Improving
Chapter 17 - The Management and Control of Quality
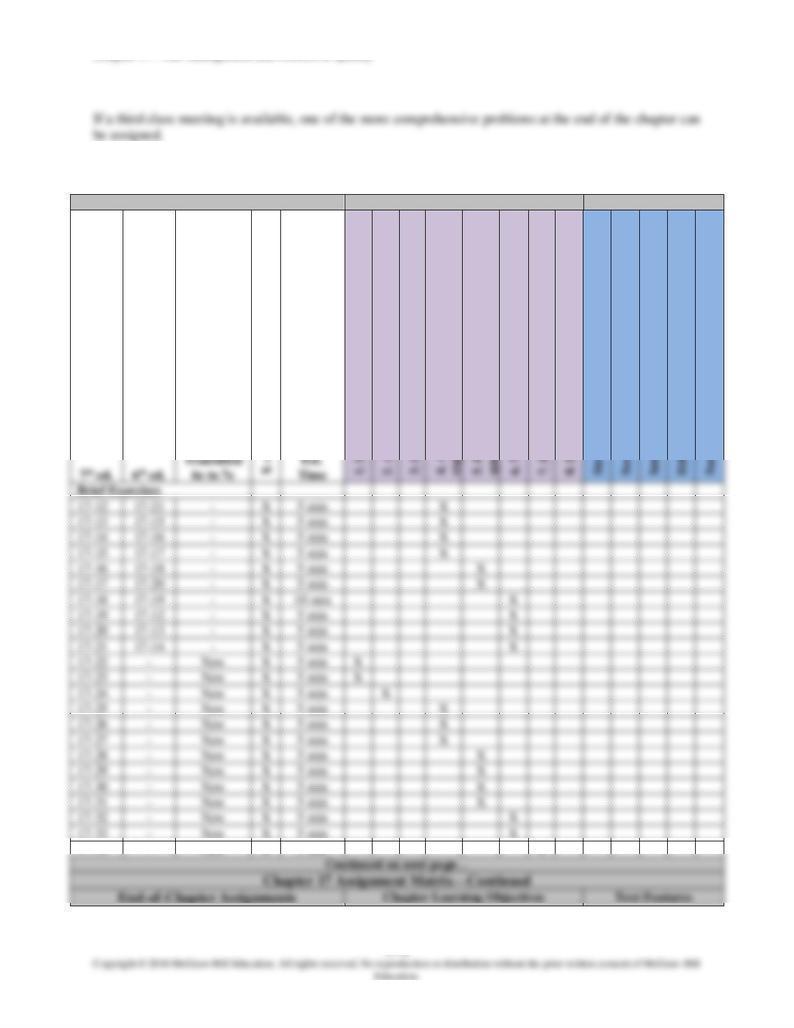
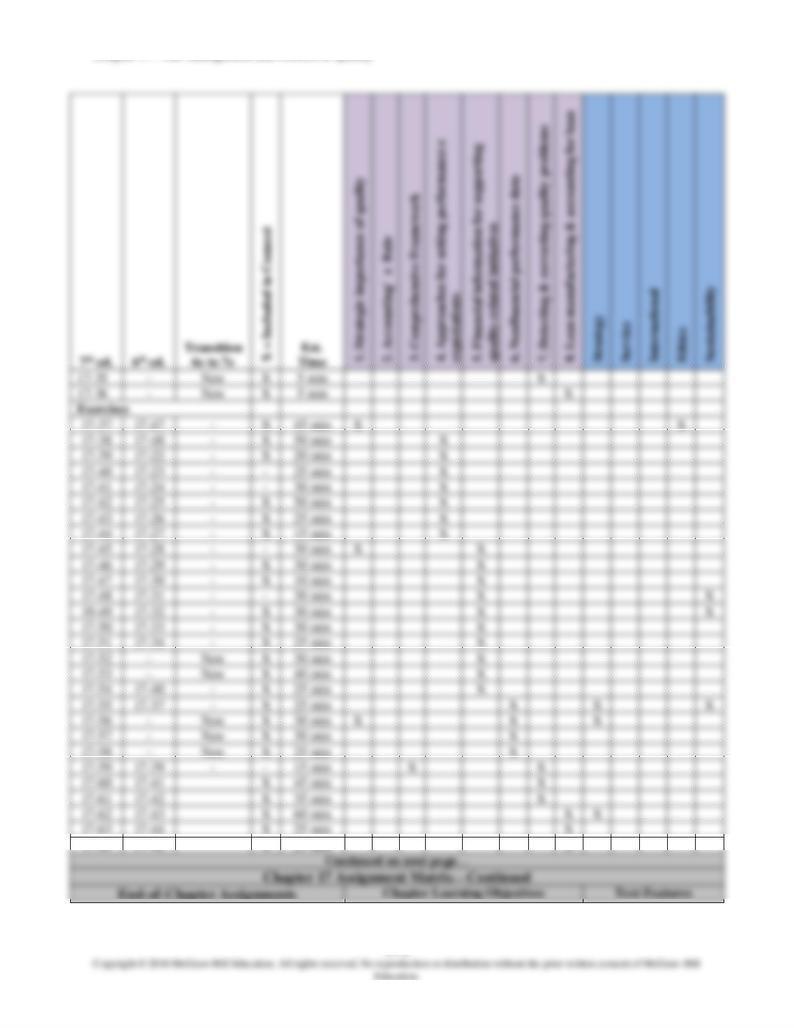
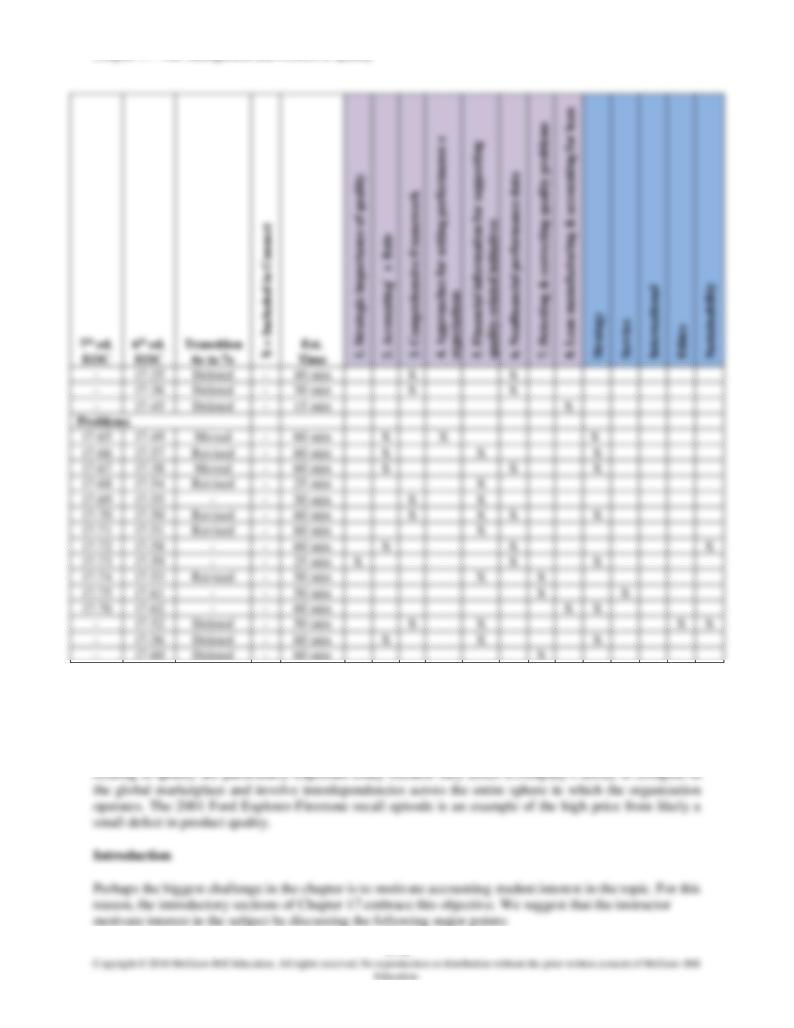
Assignment Matrix
End-of-Chapter Assignments
Chapter Learning Objectives
Text Features
17-34
-
New
X
5 min
X
Chapter 17 - The Management and Control of Quality
17-64
17-46
X
25 min
X
Chapter 17 - The Management and Control of Quality
Lecture Notes
This chapter examines the importance of quality and how management accounting can add value to the
organization through the creation of a comprehensive system for managing and controlling quality. Issues
Chapter 17 - The Management and Control of Quality
o Baldrige Award, ISO-9000, and ISO-14000
17.2 is a useful diagram for framing the discussion of the decomposition of quality into Performance
Quality and Design Quality. The former is covered in Chapter 17 while the latter is covered in Chapter 13
(Target Costing).
General Framework for Managing and Controlling Quality
Exhibit 17.3 should then be discussed with students because it provides a “big-picture” view of a process
that can be used to manage and control quality. We recommend that the instructor review with students
“key elements” of the framework. This diagram is important because most of the rest of the discussion in
the chapter can be related back to this general model. Of course, Exhibit 17.3 contains but one possible
framework. Students should recognize that other frameworks are possible and that the framework
depicted in Exhibit 17.3 can be modified according to the situation and the desires of management. Some
of the major points that can be emphasized in conjunction with text Exhibit 17.3:
o the model is customer-based (i.e., for the most part externally oriented)
o the model included feedback loops (continuous improvement philosophy)
Chapter 17 - The Management and Control of Quality
After the model depicted in Exhibit 17.3 is discussed, the instructor can discuss with students different
approaches that can be taken to develop performance standards and expectations as regards quality. In
Chapter 17 we discuss the following alternatives:
o Six Sigma performance level (including the DMAIC methodology)
o Goalpost conformance—conforms to a quality specification expressed as a range around the
target. (See Exhibit 17.4 in the text.)
o Absolute quality conformance (robust quality conformance)–requires all products or services
to meet the target value exactly, not within a range. (See Exhibit 17.5 in the text.)
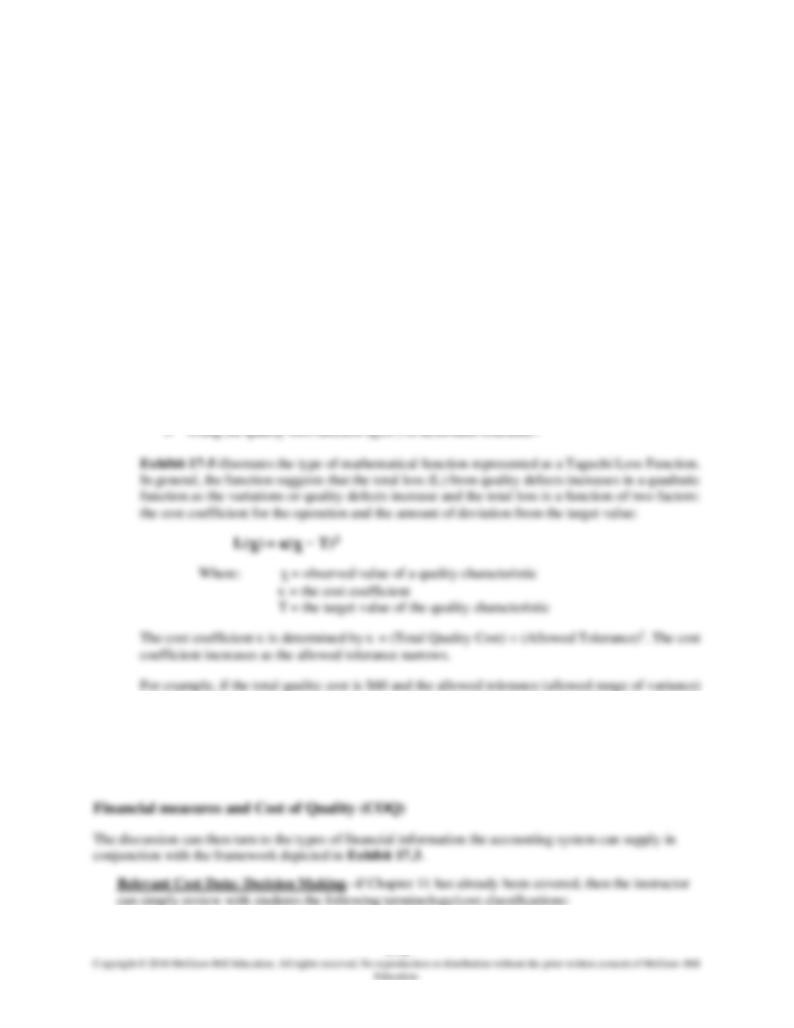
o Taguchi Quality Loss Functions (which depict quality costs/losses as a quadratic function—the
farther one gets from targeted specification for quality, the greater the “penalty” or loss to the
organization). The following topics are separately covered:
o Loss function, L(x), which can be used to depict the relationship between the total loss
due to quality defects and the extent of quality defects (i.e., deviation from targeted
specifications)
o Total quality cost/loss and average (expected) loss?
is 0.01, then the value of = $600,000. A reduction of the allowed tolerance by half (0.005)
increases the value of to $2,400,000. The cost of a quality defect increases as the allowed range
of variation decreases.
Chapter 17 - The Management and Control of Quality
• relevant cost (or revenue)
• sunk costs
• opportunity costs
The instructor can then talk about some of the decisions in the area of quality (e.g., move to JIT) that
can be addressed using the relevant costing framework.
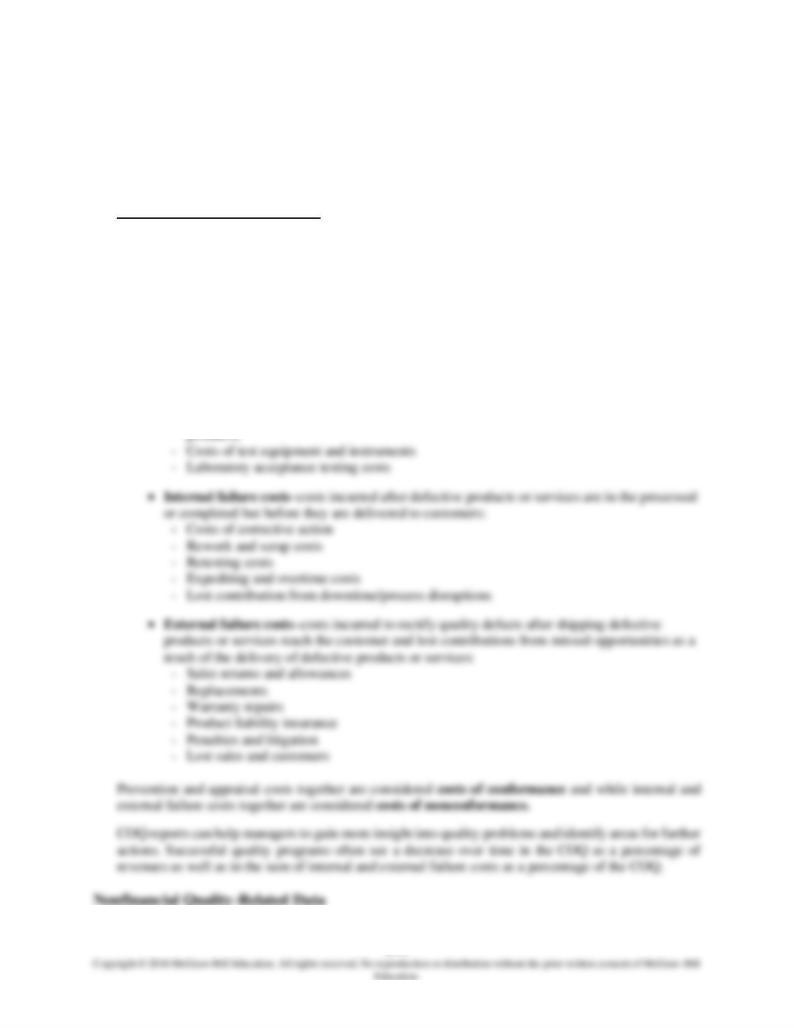
Cost of Quality (COQ) Reporting--organizations incur the costs of quality (COQ) to prevent, detect,
and rectify the production of low-quality products. There are four types of costs in a COQ Report (see
Exhibit 17.8, Exhibit 17.9, and Exhibit 17.10):
• Prevention costs–expenditures incurred to prevent the production of products or services that
do not conform to specifications. Prevention costs include:
- Quality planning costs
- Quality training costs
- Costs to install prevention programs
- Information system costs for measuring, reporting, auditing of quality
• Appraisal costs–costs incurred to determine whether products or services conform to
specifications:
- Costs to inspect incoming materials, part, components, work-in process, and finished
Chapter 17 - The Management and Control of Quality
At this point, the instructor can discuss nonfinancial quality-related information that might be produced by
the organization’s accounting system as part of its comprehensive framework (model) for managing and
controlling quality. For this purpose, it is useful to distinguish between:
o nonfinancial internal (i.e., business process) measures
o nonfinancial external (i.e., customer-satisfaction) measures (new to the 6th edition is the inclusion
of the “net promoter score” as a measure of customer loyalty/satisfaction)
The instructor should take the time at this point to discuss with students the strategic role of
nonfinancial performance indicators, as part of a comprehensive system for managing and
controlling quality.
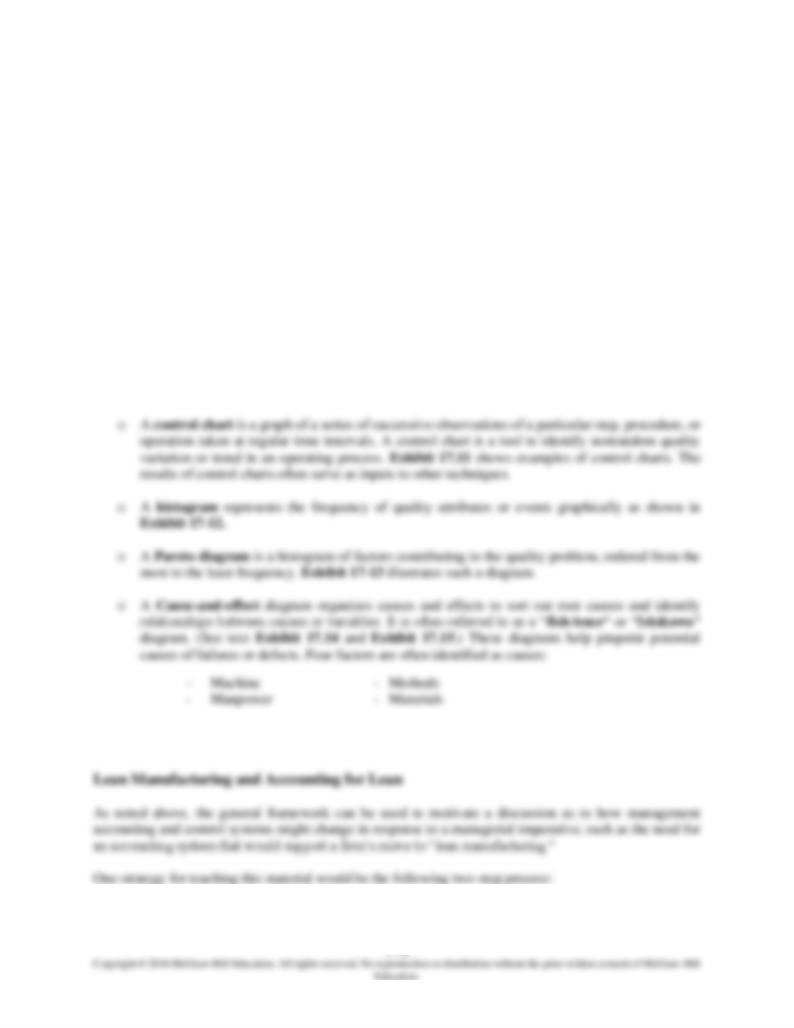
Techniques to Identify and Correct Quality Problems
The chapter, and therefore discussion of text Exhibit 17.3, can conclude with a discussion of techniques,
from operations management, that can be used to identify and analyze quality problems. We include a
discussion of: control charts, histograms, Pareto diagrams, and cause-and-effect diagrams (also called
fishbone diagrams):
Chapter 17 - The Management and Control of Quality