Build a Model Solution 11/26/2018 Reminder: delete the other scenarios in student version!
Chapter: 7 Valuation of Stocks and Corporations
Problem: 26 Value Drivers in the Free Cash Flow Valuation Model
Estimated Data for Traver-Dunlap Corporation Forecast
1 2 3
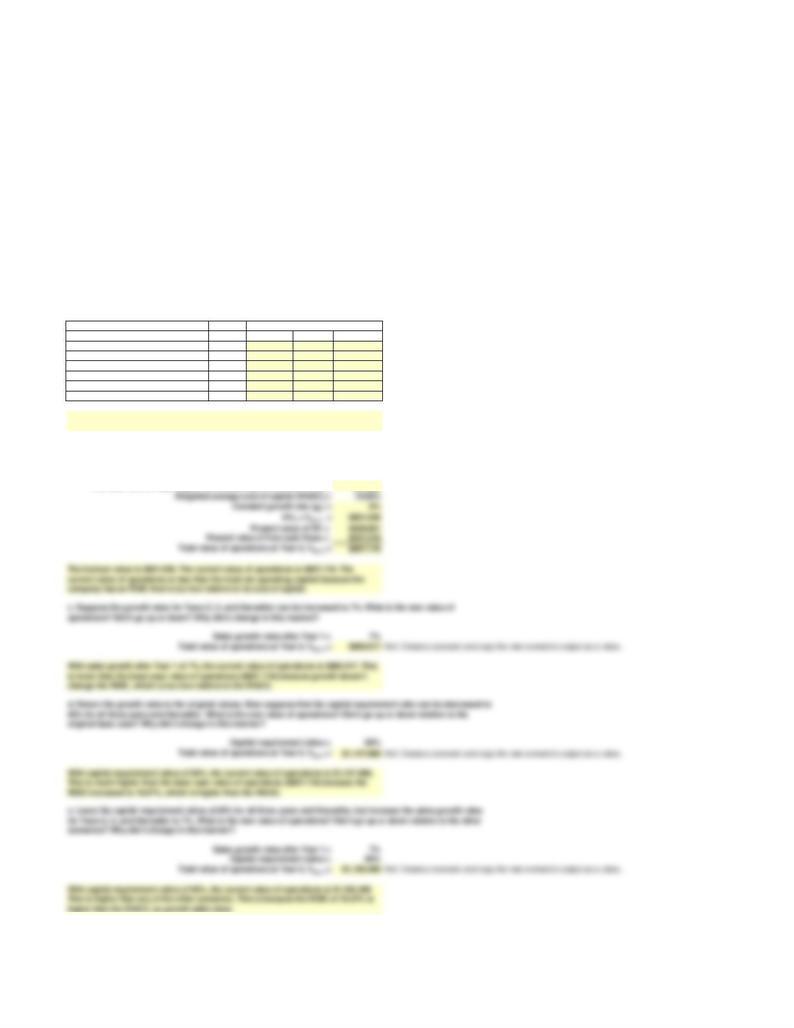
Annual sales growth rate 20% 6% 6%
Operating profitability (NOPAT/Sales) 12% 10% 10%
Capital requirement (OpCap/Sales) 80% 80% 80%
Tax rate 35% 35% 35%
Current
0 1 2 3
Sales $980 $1,176.00 $1,246.56 $1,321.35
Net operating profit after taxes $141.12 $124.66 $132.14
Total net operating capital $970 $940.80 $997.25 $1,057.08
FCF = NOPAT – Investment in OpCap $170.32 $68.21 $72.30
Growth in FCF -60% 6.0%
ROIC = NOPAT/OpCap 15.00% 12.50% 12.50%
Free cash flow at beginning of the constant growth phase (FCF3) = $72.300
Forecast Year
The Year 3 FCF growth rate is 6%, the same as the growth rate in sales. The Year 3
ROIC is 12.5% and it is lower than the WACC of 15%.
b. What is the value of operations at Year 3, Vop,3? What is the current value of operations, Vop,0? How does the value
of operations at Year 0 compare with the total net operating capital at Year 3, and what might explain this
relationship?
Traver-Dunlap Corporation's has a 15% weighted average cost of capital (WACC). Its most recent sales were $980
million and its total net operating capital is $970 million. The following shows estimates of the forecasted growth
rates, operating profitability ratios, and capital requirement ratios for the next three years. All of these ratios are
expected to remain constant after the third year. Use this information to answer the following questions.
a. Use the data to forecast sales, net operating profit after taxes (NOPAT), total net operating capital (OpCap), free
cash flow (FCF), growth rate in FCF, and return on invested capital (ROIC) for the next three years. What is the FCF
growth rate for Year 3 and how does it compare with the growth rate in sales? What is the ROIC for Year 3 and how
does it compare with the 15% WACC?