Build a Model Problem 11/26/18
Chapter: 12 Note to authors. Change income statement and balance sheets to be values (not formulas) when doing problem for students.
Problem: 11
2019
Net Sales 800.0$
Costs (except depreciation) 576.0$
Depreciation 60.0$
Earning before int. & tax 164.0$
Cash 8.0$ Accounts Payable 16.0$
Short-term investments 20.0 Notes payable 40.0
Total liabilities and equity
868.0$
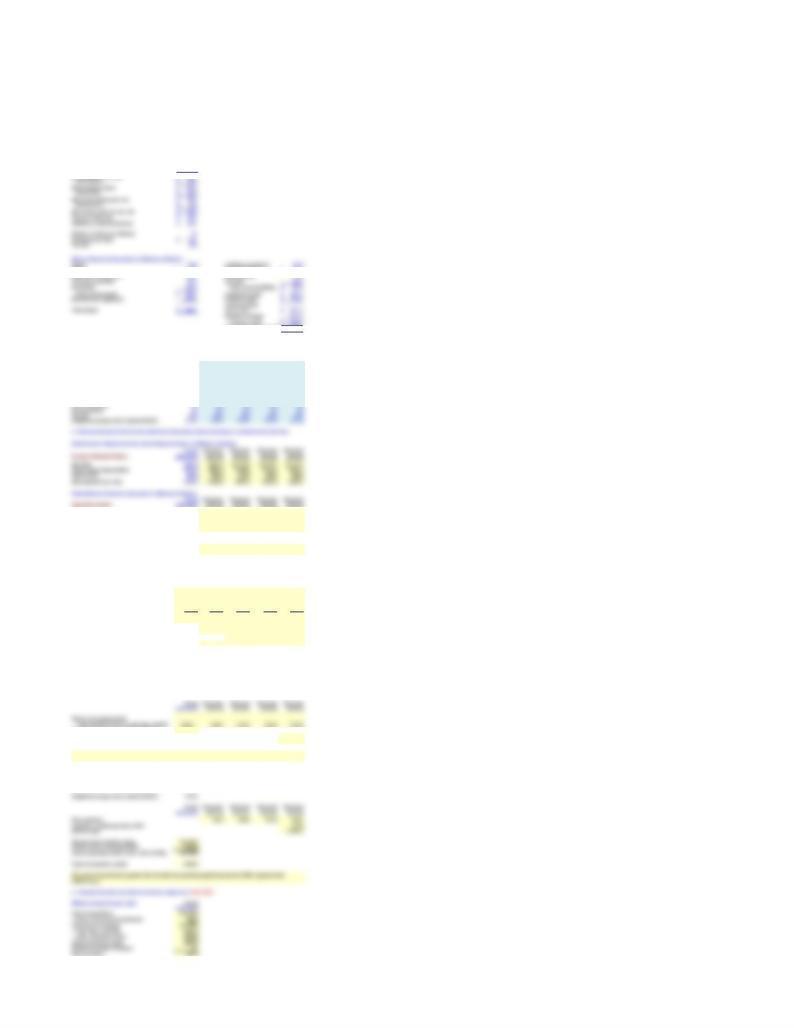
Inputs Actual Projected Projected Projected Projected
12/31/2019 12/31/20 12/31/21 12/31/22 12/31/23
Sales Growth Rate 15% 10% 6% 6%
Costs/Sales 72% 72% 72% 72% 72%
Depreciation/(Net PPE) 10% 10% 10% 10% 10%
Cash/Sales 1% 1% 1% 1% 1%
(Acct. Rec.)/Sales 10% 10% 10% 10% 10%
Inventories/Sales 20% 20% 20% 20% 20%
(Net PPE)/Sales 75% 75% 75% 75% 75%
(Acct. Pay.)/Sales 2% 2% 2% 2% 2%
Cash $8.0 $9.2 $10.1 $10.7 $11.4
Accounts receivable $80.0 $92.0 $101.2 $107.3 $113.7
Inventories $160.0 $184.0 $202.4 $214.5 $227.4
Net plant and equipment $600.0 $690.0 $759.0 $804.5 $852.8
Operating Liabilities
Accounts Payable $16.0 $18.4 $20.2 $21.5 $22.7
Accruals $40.0 $46.0 $50.6 $53.6 $56.9
Actual Projected Projected Projected Projected
Calculation of FCF 12/31/2019 12/31/20 12/31/21 12/31/22 12/31/23
Operating current assets $248.0 $285.2 $313.7 $332.5 $352.5
Operating current liabilities $56.0 $64.4 $70.8 $75.1 $79.6
Net operating working capital $192.0 $220.8 $242.9 $257.5 $272.9
Net PPE $600.0 $690.0 $759.0 $804.5 $852.8
Total net operating capital $792.0 $91 0.8 $1,001.9 $1,062.0 $1,1 25.7
NOPAT $98.4 $113.2 $124.5 $131.9 $139.9
Investment in total net operating capital na $118.8 $91.1 $60.1 $63.7
Free cash flow na -$5.6 $33.4 $71.8 $76.1
Growth in FCF na na -692.1% 115.1% 6.0%
Growth in sales 15.0% 1 0.0% 6.0% 6.0%
12.4% 12.4% 13.7% 13.2% 13.2%
Weighted average cost of capital (WACC) 10.5% 10.5% 10.5% 1 0.5% 10.5%
WACC/(1+gL)na na na 9.9%
WACC/(1+WACC) na na na 9.5%
Start with the partial model in the file Ch12 P11 Build a Model.xlsx on the textbook’s Web site, which contains
Henley Corporation’s most recent financial statements. Use the following ratios and other selected inform ation
for the current and projected years to answer the next questions.
Income Statement for the Year Ending Decembe r 31 (Millions of Dollars)
b. Calculate free cash flow for each projected y ear. Also calculate the growth rates of free cash flow eac h
year to ensure that there is constant growth (i.e., the same as the constant growth rate in sales) by the e nd of
the forecast period.
c. Calculate the return on invested capital (ROIC=NOPAT/Total net operating capital) and the growth rate in
free cash flow. What is the ROIC in the last year of the forecast? What is the long-term constant growth rate i n
free cash flow (gL is the growth rate in FCF in the last forecast period because al l ratios are constant)? Do you
think that Hensley's value would increase if it could add growth w ithout reducing its ROIC? (Hint: Growth will
add value if the ROIC > WACC/[1+WACC]). Do you think that the company will have a value of operations
greater than its total net operating capital? (Hint: Is ROIC > WACC/[1+gL]?)
d. Calculate the current value of operations. (Hint: First calculate the horizon value at the end of the foreca st
period, which is equal to the value of operations at the end of the forecast period. Assume that the annual
growth rate beyond the horizon is equal to the growth rate at the horizon.) How does the curre nt value of
operations compare with the current amount of total net operating capital ?
Projected ratios and selected information for the current and projected years are shown below.
ROIC is greater than WACC/(1+gL), so the value of operations should be greater than the total net operating
capital. Also, ROIC is greater than WACC/(1+WACC), so growth should add value.