Chapter 22
Bivariate Statistical Analysis: Differences
Between Two Variables
AT-A-GLANCE
I. What Is the Appropriate Test of Difference?
II. Cross-Tabulation Tables: The 2 Test for Goodness of Fit
III. The t-Test for Comparing Two Means
A. Independent samples t-Test
• Independent samples t-test calculation
• Practically speaking
B. Paired samples t-test
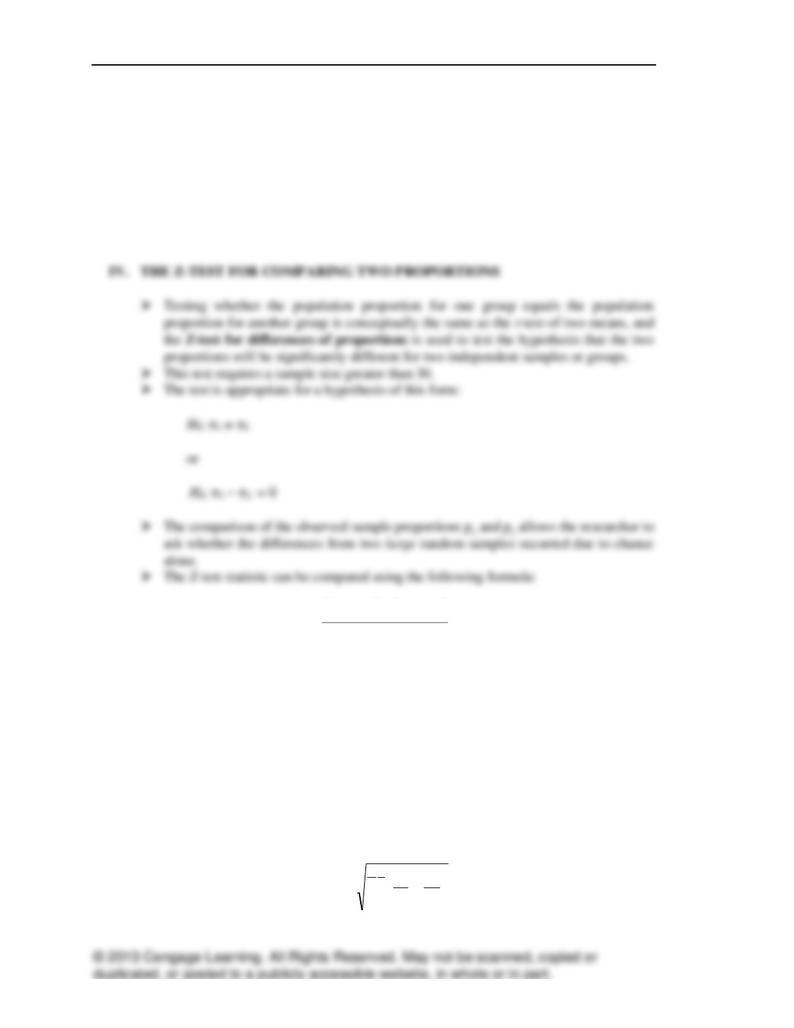
IV. The Z-Test for Comparing Two Proportions
V. Analysis of Variance (ANOVA)
A. What is ANOVA?
362 Part Six: Data Analysis and Presentation
5. Interpret an ANOVA table
CHAPTER VIGNETTE: Gender Differences and Double Standards
in Ethical Perceptions
Ethical conduct, both of businesses and consumers, is an important issue in the business world. A
research studied examined if there is a difference between women and men in their ethical
3. Is there a difference among the various student classifications and their attitude
regarding their goal achievement and life satisfaction? Use ANOVA.
RESEARCH SNAPSHOTS
➢ Accurate Information? How About a Chi-Square Test?
When is a cross tabulation with a 2 appropriate? When the answer is “yes” to the
following questions:
▪ Are multiple variables expected to be related to one another?
▪ Is the independent variable nominal or ordinal?
▪ Is the dependent variable nominal or ordinal?
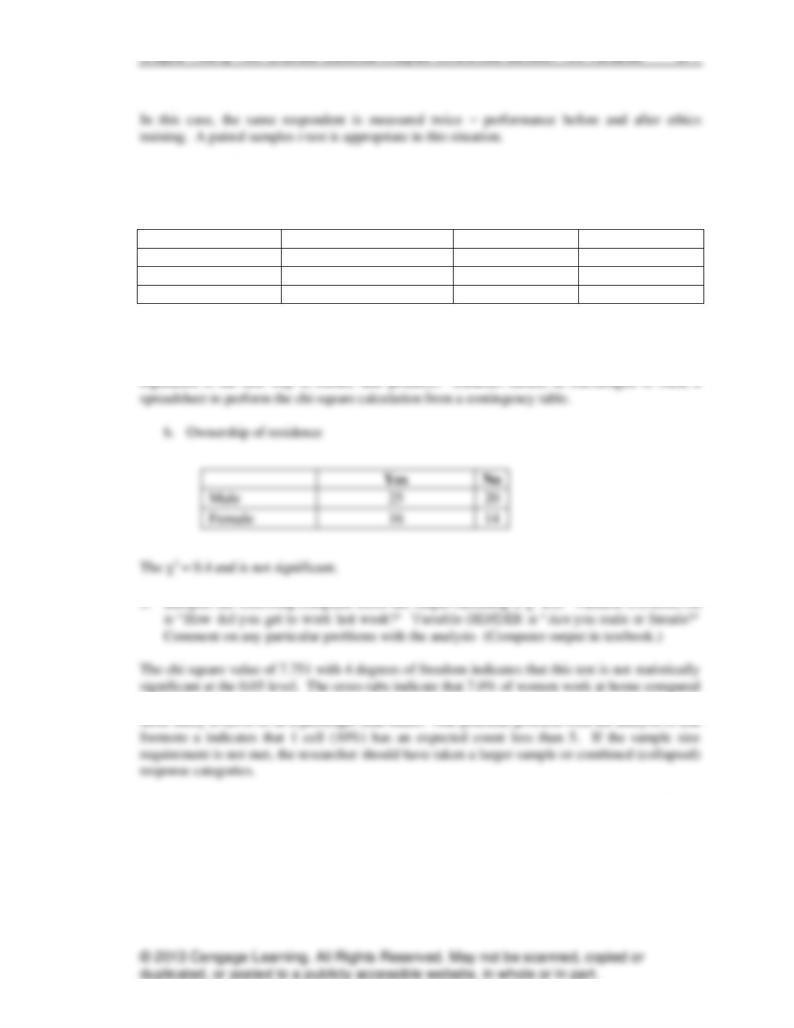
An example of whether or not the adoption of a new information system produced
accurate or inaccurate information is provided, and the 2 X 2 contingency table with the
2 is given and indicates that the new technology is associated with more incidences of
accurate rather than inaccurate information.
Chapter Twenty-Two: Bivariate Statistical Analysis: Differences Between Two Variables 363
➢ Expert “T-eeze”
When is an independent samples t-test appropriate? When the answer is “yes” to the
following questions:
▪ Is the dependent variable interval or ratio?
▪ Can the dependent variable scores be grouped based upon some categorical
variable?
▪ Does the grouping result in scores drawn from independent samples?
▪ Are two groups involved in the research question?
An example looking at the difference in speed for expert and novice salespeople faced
with the same situation is given. Decision speed is a ratio dependent variable and the
scores are grouped based on whether or not the salesperson is an expert or a novice,
which produces two groups. The conclusion is that experts do take less time to make a
decision than do novices.
➢ More Than One-Way
An independent samples t-test is a special case of one-way ANOVA. When the
independent variable in ANOVA has only two groups, the results for an independent
samples t-test and ANOVA will be the same, and an example is given to show this. The
F-ratio shown in the ANOVA table is associated with the same p-value as is the t-value,
which is no accident since the F and t are mathematical functions of one another.
OUTLINE
364 Part Six: Data Analysis and Presentation
2. Examine to see if the differences between the observed and expected values are
consistent with the hypothesized prediction.
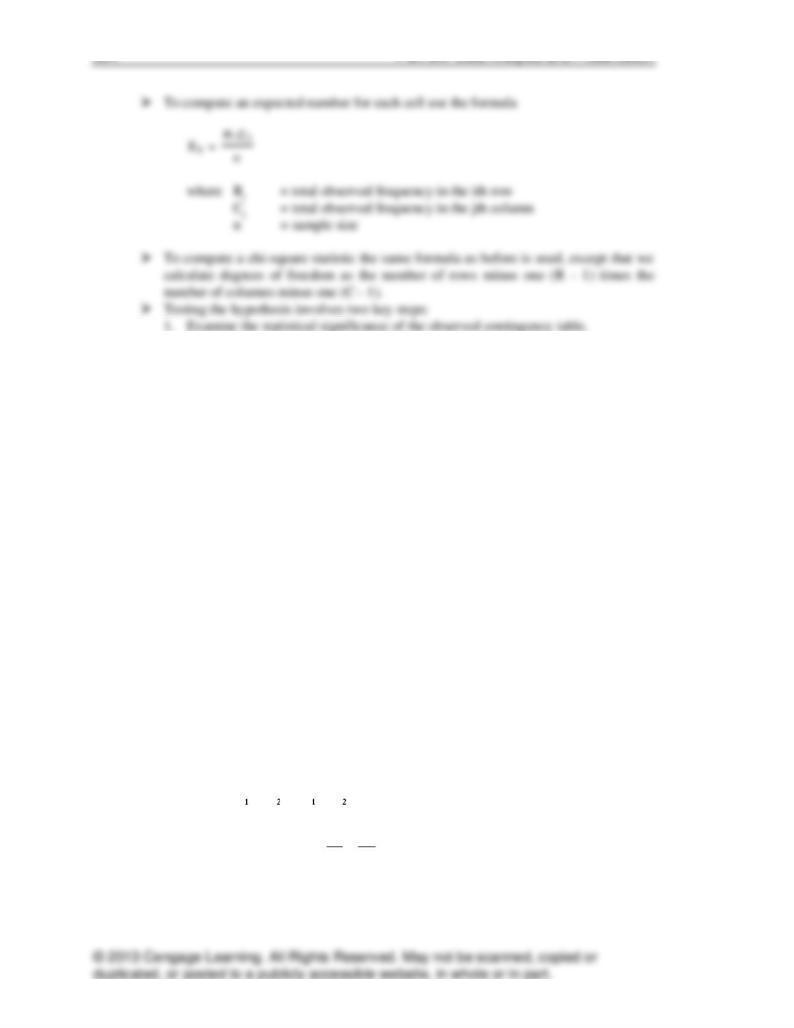
➢ Proper use of the chi-square test requires that each expected cell frequency (Eij) have
a value of at least 5.
➢ If this sample size requirement is not met, the researcher should take a larger sample
or combine (collapse) response categories.
III. THE t-TEST FOR COMPARING TWO MEANS
➢ Independent Samples t-test
➢ A t-test is appropriate for when a researcher needs to compare means for a
variable grouped into two categories based on some less than interval variable.
➢ One way to think about this is as testing the way a dichotomous (two-level)
independent variable is associated with changes in a continuous dependent
variable.
➢ Most typically, the researcher will apply the independent samples t-test which
tests the differences between means taken from two independent samples or
groups.
➢ This test assumes the two samples are drawn from normal distributions and that
the variances of the two populations are approximately equal (homoscedasticity).
➢ Independent Samples t-test Calculation
• The t-test actually tests whether or not the differences between two means is
zero.
• The null hypothesis is normally stated as:
=
or
−
= 0
• However, since this is inferential statistics, we test the idea by comparing
two sample means (
21 XX −
).
• Thus, the t-value is a ratio with information about the differences between
means (provided by the sample) in the numerator and the standard error in
the denominator.
Chapter Twenty-Two: Bivariate Statistical Analysis: Differences Between Two Variables 365
• The question is whether the observed differences have occurred by chance
alone.
• A pooled estimate of the standard error is a better estimate of the standard
error than one based on the variance from either sample.
• A higher t-value is associated with a lower p-value, and as the t gets higher
and the p-value gets lower, the researcher has more confidence that the
means are truly different.
• In a test of two means, the degrees of freedom are calculated as follows:
▪ d.f. = n – k (where n = n1 + n2 and k = number of groups)
• Table A.3 in the appendix yields the critical t-values.
➢ Practically Speaking
• In practice, computer software is used to compute the t-test results.
• Exhibit 22-2 displays a typical t-test printout.
1. Strictly speaking, the t-test assumes that the two population variances are
2. Even though the means appear to be not so close to each other, the
3. As samples get larger, the t-test and Z-test will tend to yield the same
result.
• A t-test can be used with large samples.
• A Z-test should not be used with small samples.
366 Part Six: Data Analysis and Presentation
• Also, a Z-test can be used in instances where the population variance
is known ahead of time.
➢ Paired Samples t-Test
➢ A paired samples t-test is appropriate when means that need to be compared are
not from independent samples (i.e., the same respondent is measured twice).
➢ When a paired samples t-test is appropriate, the two numbers being compared are
usually scored as separate variables.
Z =
( ) ( )
21
2121
pp
S
pp
−
−−−
where p1 = sample proportion of successes in group 1
p2 = sample proportion of successes in group 2
π 1 – π 2 = hypothesized population proportion 1 minus hypothesized
population proportion 2
Sp1–p2 = pooled estimate of the standard error of differences in
proportions
➢ The statistic normally works on the assumption that the value of π 1 – π 2 is zero, so this
formula is actually much simpler than it looks at first inspection.
➢ Also notice the similarity between this and the paired-samples t-test.
➢ To calculate the standard error of the differences in proportions, use the formula:
Sp1–p2 =
+
21
11 nn
qp
where

Chapter Twenty-Two: Bivariate Statistical Analysis: Differences Between Two Variables 367
p
= pooled estimate of proportion of successes in a sample
q
= 1 –
p
, or pooled estimate of proportion of failures in a sample
n1= sample size for group 1
n2= sample size for group 2
➢ To calculate the pooled estimator,
p
, use the formula:
21
2211 nn pnpn
p+
+
=
V. ANALYSIS OF VARIANCE (ANOVA)
➢ What is ANOVA?
➢ When the means of more than two groups or populations are to be compared,
one-way analysis of variance (ANOVA) is the appropriate statistical tool.
➢ ANOVA involving only one grouping variable is often referred to as one-way
ANOVA because only one independent variable is involved.
➢ Another way to define ANOVA is as the appropriate statistical technique to
examine the effect of a less than interval independent variable on an at least
interval dependent variable.
➢ An independent samples t-test can be thought of as a special case of ANOVA in
which the independent variable has only two levels.
• When more levels exist, the t-test alone cannot handle the problem.
➢ The null hypothesis in such a test is that all the means are equal—that is,
=
=
… up to K where K is the number of groups or categories for an
368 Part Six: Data Analysis and Presentation
Chapter Twenty-Two: Bivariate Statistical Analysis: Differences Between Two Variables 369
3. SST – the total observed variation across all groups and individual
observations. Thus, total variability can be partitioned into within-
group variance and between-group variance.
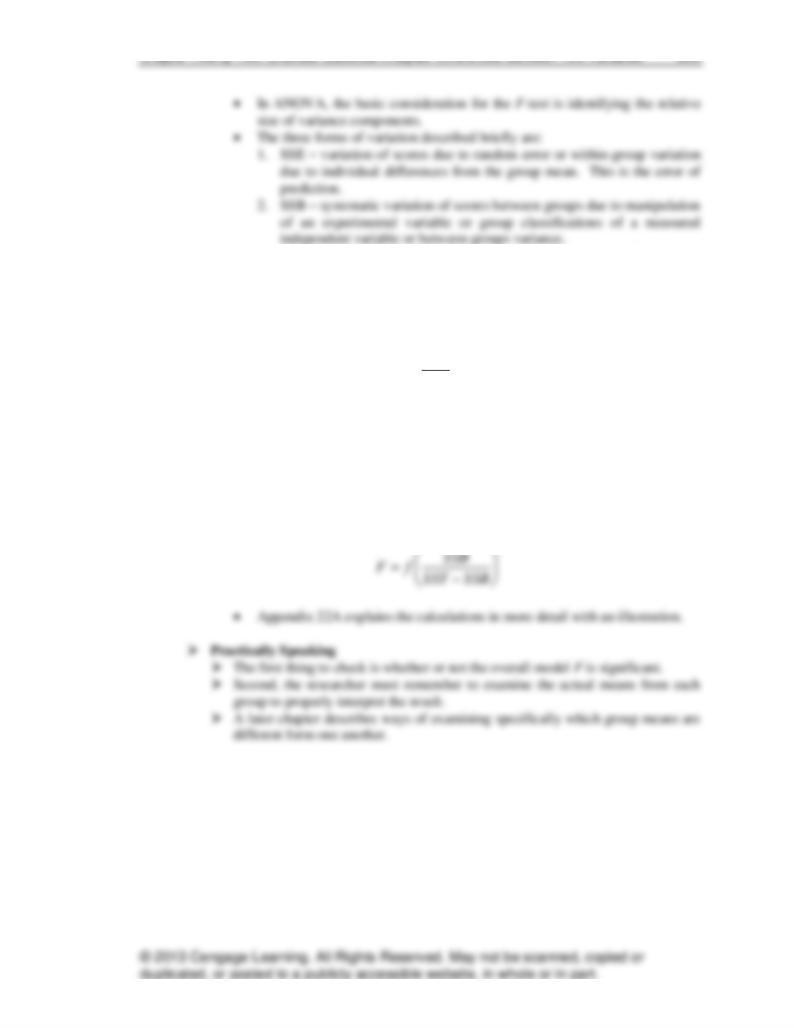
• The F-distribution is a function of the ratio of these two sources of variance:
=SSE
SSB
fF
• A larger ratio of variance between groups to variance within groups implies a
greater value of F.
• If the F-value is large, the results are likely to be statistically significant.
➢ A Different but Equivalent Representation
• F also can be thoughts of as a function of the between group variance and
total variance.

370 Part Six: Data Analysis and Presentation
are 20-30 years old, 30-40 years old, and 40-6- years old are to be compared.
Contributions measured in dollars is a ratio-scaled dependent variable. Because there are three
groups, analysis of variances is the appropriate test of differences of the means.
c. Human resource managers and chief executive officers have responded “yes,” “no,” or
“not sure” to an attitude question. The HR and CEO responses are to be compared.
A chi-square test is appropriate because we are comparing managers and supervisors on a
categorical variable, nominal scale.
d. One-half of a sample received an incentive in a mail survey while the other half did not.
A comparison of response rates is desired.
If we are going to compare the proportion of survey respondents in each of the two groups, then a
t-test for differences of proportions is the appropriate test. If the sample size is large, a Z-test is
used.
Chapter Twenty-Two: Bivariate Statistical Analysis: Differences Between Two Variables 371
2. Perform a 2 test on the following data:
a. Regulation is the best way to ensure safe products.
Agree
Disagree
No Opinion
Managers
58
66
8
Line Employees
34
24
10
Totals
92
90
18
2 = 6.24, d.f. = 2. From Table A.4 in the Appendix, we see that the critical value at the 0.05
probability level with 2 d.f. is 5.991. Managers are significantly more likely to disagree that
to 17.9% of men. Men are more likely to take the bus (28.6%) than women (18.6%). Females are
4. A store manager’s computer-generated list of all retail sales employees indicates that 70
percent are full-time employees, 20 percent are part-time employees, and 10 percent are
furloughed or laid-off employees. A sample of 50 employees from the list indicates that there
are 40 full-time employees, 6 part-time employees and 4 furloughed/laid-off employees.
Conduct a statistical test to determine if the sample is representative of the population.
Population Expected Observed
372 Part Six: Data Analysis and Presentation
Distribution Frequency Frequency
Full-time 70% 35 40
Part-time 20 10 6
Laid-off 10 5 4
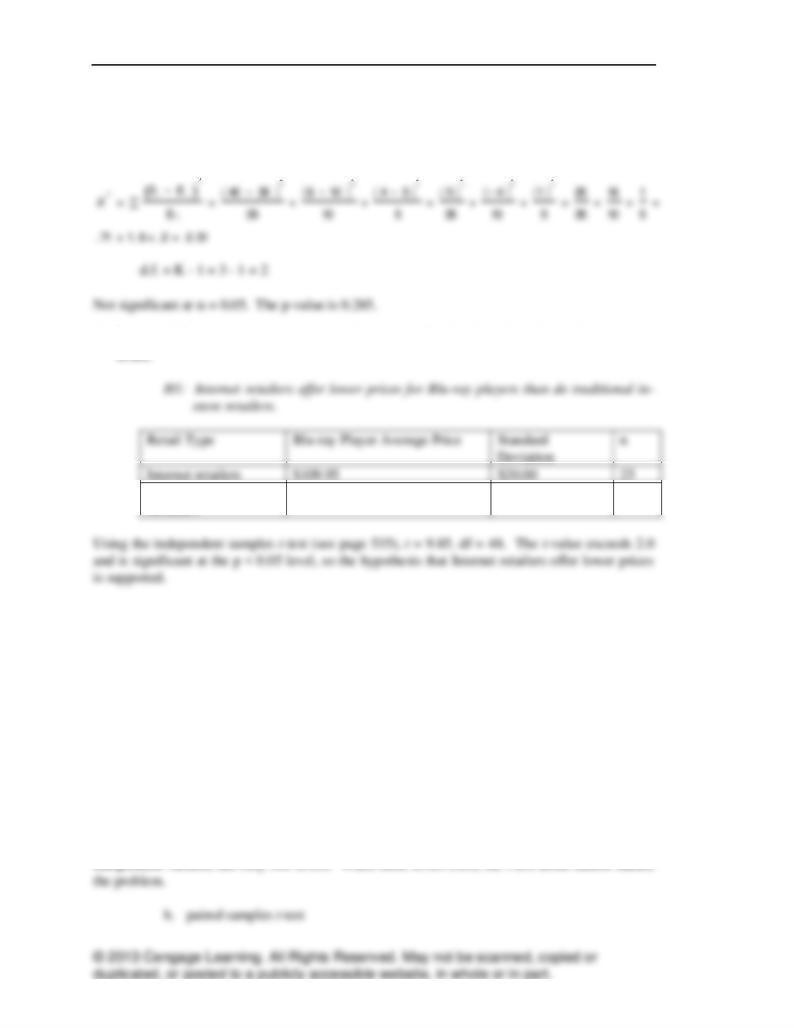
5. Test the following hypothesis using the data summarized in the table below. Interpret your
Multi-Channel
Retailers
$159.30
$45.00
25
6. How does an independent samples t-test differ from the following?
First, an independent samples t-test should be explained. When a researcher needs to compare
means for a variable grouped into two categories based on some less than interval variable, a t-
test is appropriate. One way to think about this is as testing the way a dichotomous (two levels)
independent variable is associated with changes in a continuous dependent variable. Several
variations of the t-test exist. Most typically, the researcher will apply the independent sample t-
test which tests the differences between means taken from two independent samples or groups.
a. one-way ANOVA
When the means of more than two groups or populations are to be compared, one-way ANOVA
is the appropriate statistical tool. This is the appropriate statistical technique to examine the
effect of a less than interval independent variable on an at least interval dependent variable. An
independent samples t-test can be thought of as a special case of ANOVA in which the
Chapter Twenty-Two: Bivariate Statistical Analysis: Differences Between Two Variables 373
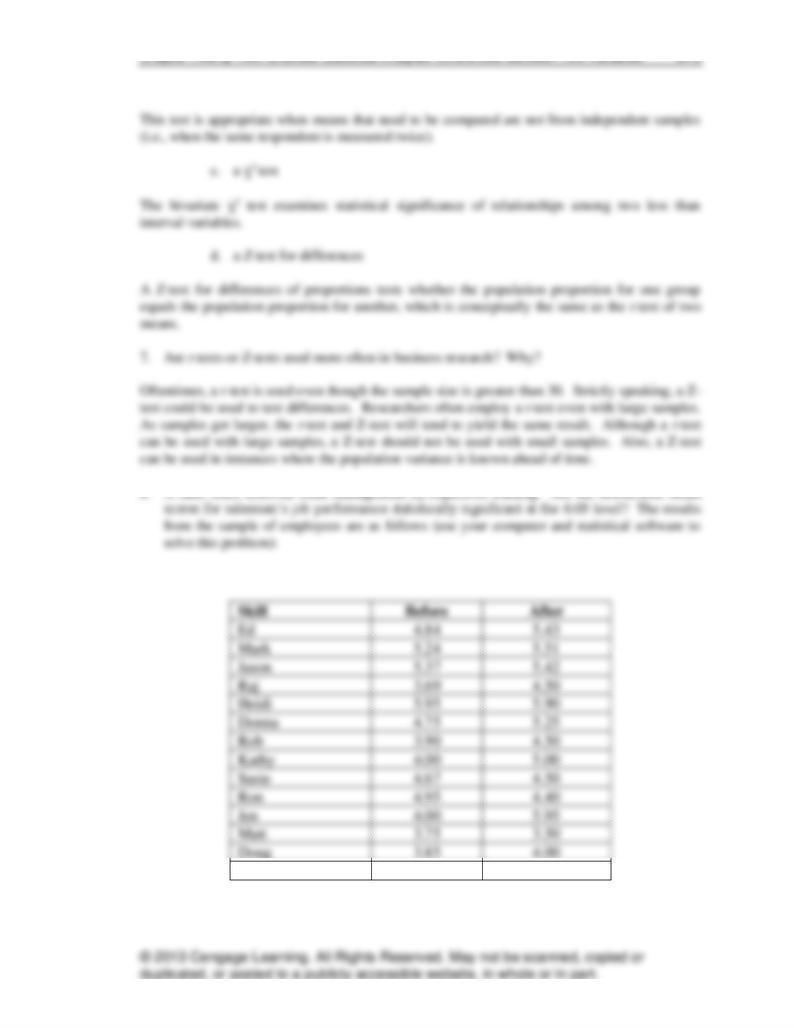
Bob
5.00
4.10
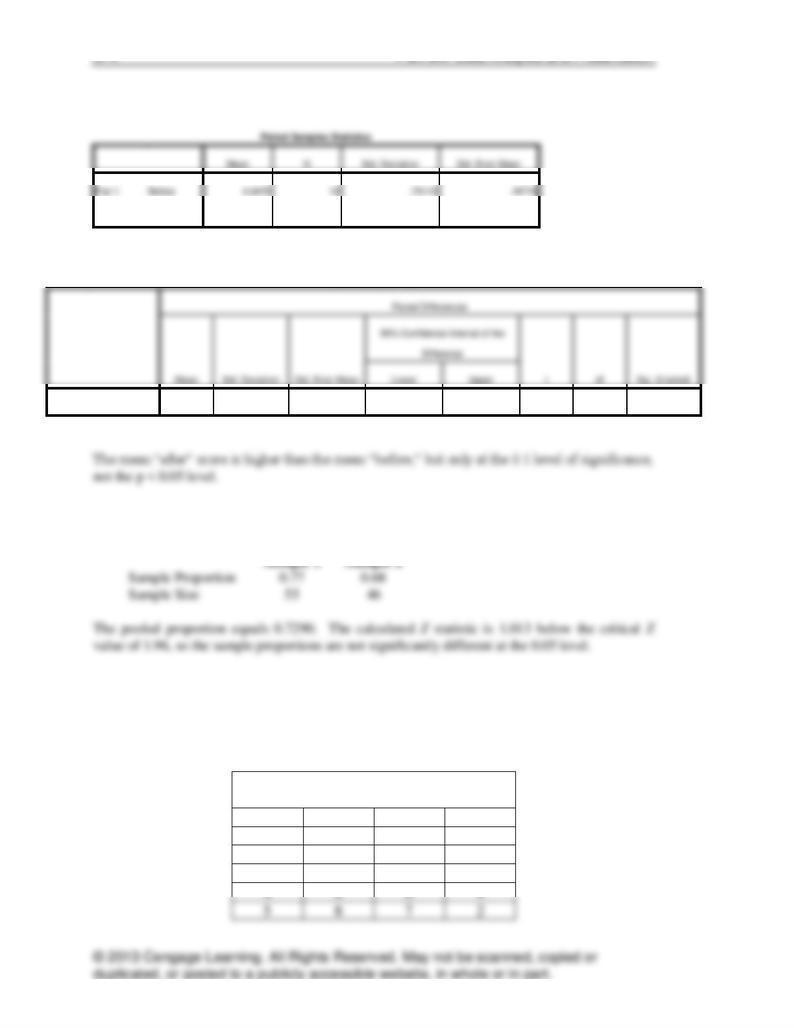
SPPS Output:
374 Part Six: Data Analysis and Presentation
After
4.8038
16
.75433
.18858
Paired Samples Test
Pair 1
Before - After
-.35625
.69835
.17459
-.72837
.01587
-2.041
15
.059
9. Conduct a Z-test to determine whether the following two samples indicate that the
population proportions are significantly different at the 0.05 level.
10. In an experiment with wholesalers, a researcher manipulated perception of task difficulty
and measured level of aspiration for performing the task a second time. Group 1 was told
the task was very difficult, group 2 was told the task was somewhat difficult but attainable,
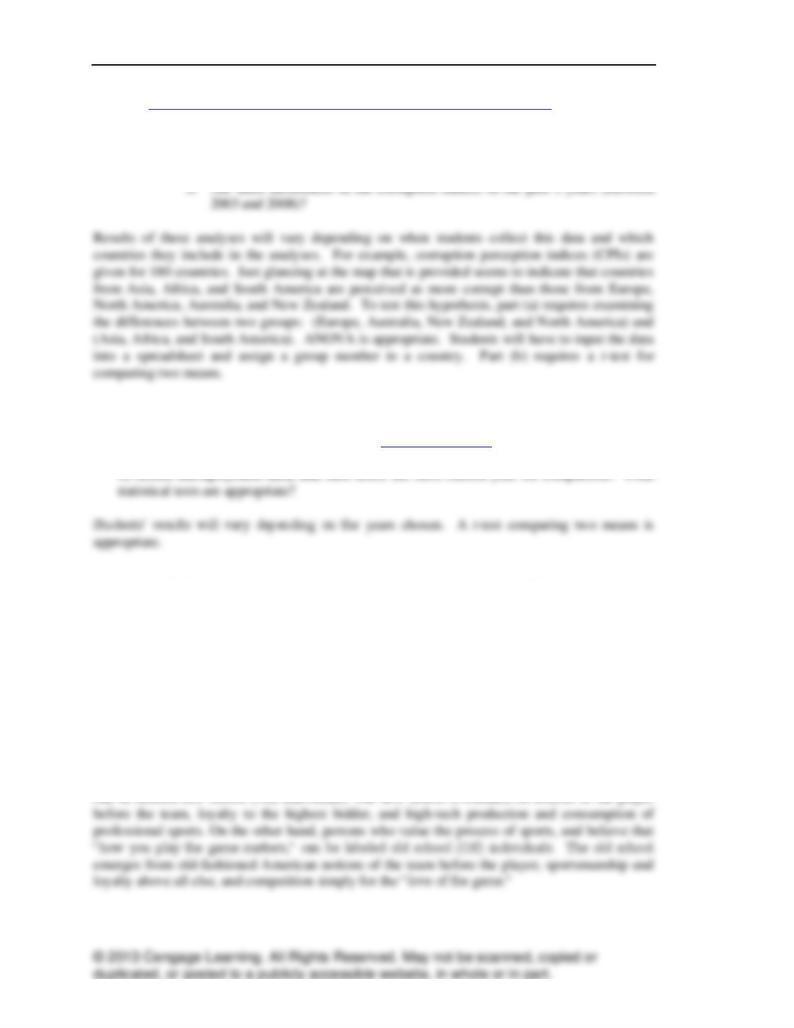
and group 3 was told the task was easy. Perform an ANOVA on the resulting data:
LEVEL OF ASPIRATION
(10-POINT SCALE)
Subjects
Group 1
Group 2
Group 3
1
6
5
5
2
7
4
6
3
5
7
5
Chapter Twenty-Two: Bivariate Statistical Analysis: Differences Between Two Variables 375
Total
18
5.6111
1.64992
.38889
4.7906
6.4316
2.00
8.00
Total
46.278
17
11. Interpret the following output (see the textbook for the output) examining group differences
for purchase intentions. The three groups refer to consumers from three states: Illinois,
Louisiana, and Texas.
1. [Ethics Question/Internet Question] How ethical is it to do business in different countries
around the world? An international organization, Transparency International, keeps track of
the perception of ethical practices in different countries. Visit the Web site and search for the
376 Part Six: Data Analysis and Presentation
CPI (http://www.transparency.org/policy_and_research/surveys_indices/cpi). Using the data
found here, test the following research questions.
a. Are Nations from Europe and North America perceived to be more ethical
than nations from Asia, Africa and South America?
2. [Internet Question] The Bureau of Labor Statistics of the United States Government
maintains a website that contains current and historic data related to the United States
economy. Navigate to the BLS website at http://www.bls.gov. In the “Latest Numbers”
section, select the small dinosaur next to the Unemployment Rate link. Select a year and its
CASE 22.1 Old School versus New School Sports Fans
Data: Students are instructed to download the data from the website or to request them from the
instructor.
Objective: Illustrating the analysis of a chi-square test from an SPSS computer program is the
purpose of this case.
Summary: Three academic researchers investigated the idea that, in America in sports, there are
two segments with opposing views of what each considers as the goal of competition (i.e.,
winning versus self-actualization) and the acceptable/desirable way of achieving this goal.
Persons who believe in “winning at any cost” are proponents of sports success as a product and
Chapter Twenty-Two: Bivariate Statistical Analysis: Differences Between Two Variables 377
3.3 total pct or % of Total
This cell can be compared for men who are high on the scale. It indicates there is a very small
percentage difference between men and women. Inspection of other cells indicates that 52.9 % or
women are low but only 37.8% of men score low.
378 Part Six: Data Analysis and Presentation